

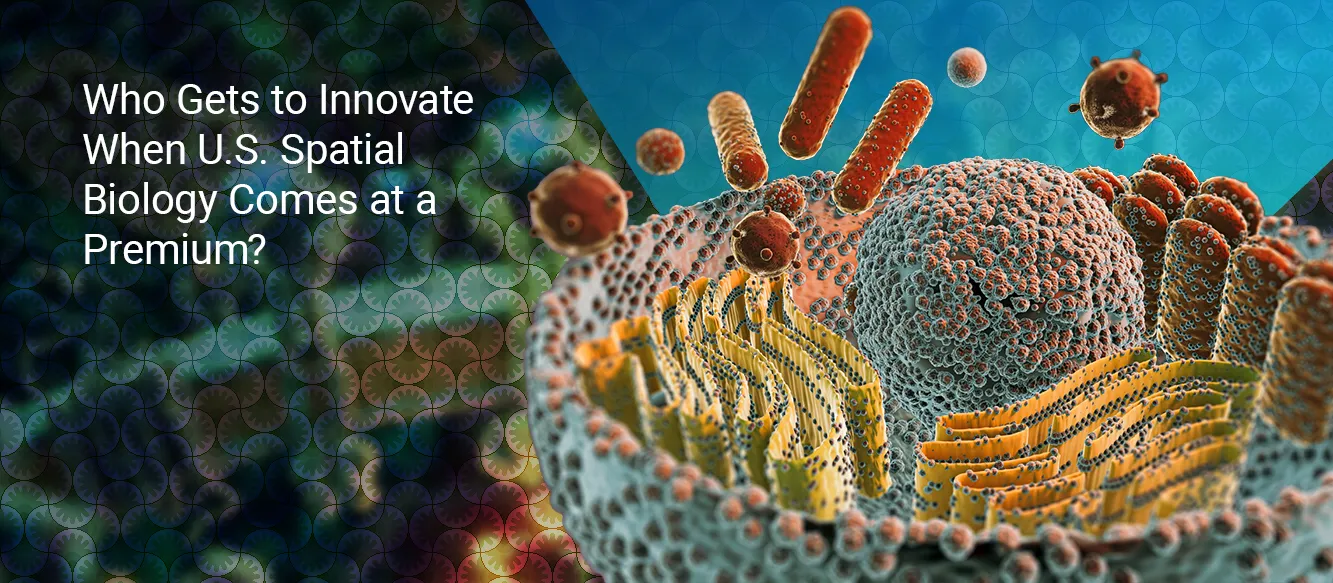
The Cost Question Unaddressed in Spatial Biology
What is Spatial Biology?
Spatial biology provides a window into complex tissue architecture by mapping cellular RNA and protein expression within intact physiological locations. While traditional single-cell sequencing disaggregates tissues into isolated suspensions, spatial approaches preserve structural context, revealing cellular microenvironments, intercellular signaling pathways, and tissue organization.
Despite its research and translational utility, the steep entry cost creates a systemic divide across the American scientific community. According to Kings Research, the U.S. spatial biology market is expected to reach USD 1,251.9 million by 2033 from USD 343.3 million in 2025, growing at a CAGR of 17.55% from 2026 to 2033. Yet, this expanding financial valuation masks an emerging structural disparity. Elite, highly endowed centers maintain disproportionate access to high-multiplex platforms, whereas resource-constrained regional universities, independent research institutes, and early-stage biotechnology startups remain priced out.
Public funding structures highlight this institutional gap. Data from the National Institutes of Health (NIH) indicates that out of nearly $48 billion in enacted agency budget, about 82 percent is awarded outside the NIH itself through almost 50,000 competitive grants. However, data from the National Science Foundation (NSF) shows that funding still concentrates heavily at the top, with the top 30 institutions accounting for over 42 percent of total academic R&D spending. This financial concentration creates a two-tier hierarchy across American life sciences, where access to spatial omics depends heavily on institutional endowment size rather than scientific merit alone.
What Does It Actually Cost to Run Spatial Biology Workflows?
Implementing spatial omics requires capital outlays far exceeding conventional molecular biology workflows. A complete spatial laboratory deployment demands multi-layered investments spanning instrumentation, custom consumables, computing architecture, and highly skilled labor. The high expense remains driven by complex hardware, including integrated optics and microfluidics.
To illustrate the market landscape and associated costs, the following table details major spatial platforms and verified academic pricing:
|
Machine / System |
Manufacturer & Location |
Technology Type |
Published Pricing / Rates |
Source & Verification |
|
Visium |
10x Genomics (Pleasanton, CA) |
Spatial Transcriptomics |
$589 internal / $963 ext. academic / $1,048 ext. non-academic (Assisted run) |
Boston University Spatial Biology Core (Fetched Aug 2026) |
|
Xenium Analyzer |
10x Genomics (Pleasanton, CA) |
High-multiplex Spatial Imaging |
$394,668.75 instrument purchase / $70 per hour (Special analysis services) |
Government Scientific Source (GSA Contract) / Univ. of Pittsburgh |
|
CosMx SMI |
Bruker Spatial Biology (Seattle, WA) |
Spatial Single-Cell Imaging |
Variable core/service provider rates |
Bruker Spatial Biology (formerly NanoString) |
|
GeoMx DSP |
Bruker Spatial Biology (Seattle, WA) |
Spatial Transcriptomics & Proteomics |
Variable core/service provider rates |
Bruker Spatial Biology |
|
MERSCOPE |
Vizgen (Cambridge, MA) |
Highly Multiplexed FISH Imaging |
Variable core/service provider rates |
Vizgen |
Instrumentation Costs and Capital Expenditure
High-multiplex spatial imaging platforms and spatial transcriptomics instruments range from $300,000 to $750,000 per unit (for example, a single 10x Genomics Xenium Analyzer is listed at $394,668.75 on federal GSA contract schedules through Government Scientific Source). These systems require precise automated microfluidic fluid delivery systems and real-time environmental control chambers. As the NIH Office of Research Infrastructure Programs (ORIP) notes, "Instruments that are awarded are typically too expensive to be obtained by an individual investigator with a research project grant."
Consumables and Per-Sample Expenses
Reagents, specialized target probes, barcoded slides, and enzymatic assay kits represent a heavy ongoing operational expense. Average reagent-only expenses range between $1,200 and $4,500 per sample slide (excluding full-service processing or core facility labor charges), depending on target panel depth, tissue surface area, and resolution limits.
Data Processing and Storage Overhead
According to official 10x Genomics documentation, processed output archive datasets range from 0.3 GB to 165 GB per sample depending on tissue area and panel multiplexing, while raw internal sensor data can reach tens of terabytes per sample. While the National Human Genome Research Institute (NHGRI) tracks genomics data costs showing that raw DNA sequencing has plummeted to fractions of a cent per megabase, the computational burden has shifted. Managing spatial data requires immense computational infrastructure. Publicly available rate schedules from institutions like the University of Pittsburgh's Center for Advanced Genomics bill single-cell data analysis at $76 per hour, and special analysis services at $70 per hour in the core that runs its Visium and Xenium spatial work. This can easily add hundreds of dollars in hidden informatics costs per sample just to align and process the raw images.
Skilled Labor and Infrastructure Costs
Operating these workflows requires cross-disciplinary expertise spanning histopathology, optics, computational biology, and spatial statistics. The U.S. Bureau of Labor Statistics (BLS) reports that the mean annual wage for 'Biological Scientists, All Other' (SOC 19-1029) sits at $99,060 as of May 2023. However, securing this specialized talent in primary life science hubs costs significantly more, with mean wages for these scientists reaching $139,600 in the San Francisco Bay Area.
Worked Example: 50-Sample Oncology Study Cost
To illustrate operational expenses, consider an illustrative, hypothetical 50-sample human tumor microenvironment profiling project conducted by a mid-sized U.S. academic center:
|
Line Item |
Expense Basis / Description |
Estimated Cost |
Share of Total Cost |
|
Primary Hardware Allocation |
Amortized instrument depreciation per project |
$15,000 |
6.9% |
|
Consumables and Target Reagents |
50 slides at an assumed rate of $3,200/slide |
$160,000 |
73.2% |
|
Tissue Processing & Quality Control |
Sectioning, staining, and QC assays |
$12,500 |
5.7% |
|
Bioinformatics Processing & Storage |
15 Terabytes raw output data |
$18,000 |
8.2% |
|
Dedicated Scientific Labor |
200 hours at $65/hour |
$13,000 |
6.0% |
|
Total Estimated Project Cost |
Comprehensive 50-sample study total ($4,370/sample) |
$218,500 |
100.0% |
This illustrative scenario demonstrates why smaller research teams frequently exhaust annual operating budgets on single proof-of-concept projects.
Who Can Afford Spatial Biology Today? Mapping the Access Landscape
Access to spatial biology platforms aligns closely with financial capital and institutional infrastructure across the United States research landscape. The primary adopters include pharmaceutical giants, Tier-1 academic entities, and Contract Research Organizations (CROs). This concentration is explicitly visible in the two-tier pricing models published by public universities, which charge steep premiums for outside researchers seeking spatial access. For example, the University of Georgia's spatial biology facility (on a rate card dated 11 February 2026) charges its in-house researchers $31.75 to $34.53 an hour for machine time and $669.27 per slide. Outsiders, however, pay $78.13 an hour and $769.66 per slide, meaning external users pay roughly two and a half times as much for basic machine access.
Similarly, the Boston University Spatial Biology Core publishes three separate pricing tiers. Based on our arithmetic from their published rates, outside academics pay a roughly 63% markup, and corporate users pay a 78% markup over internal researchers. An assisted Visium CytAssist run costs $589 in-house, but jumps to $963 for outside academics and $1,048 for companies, while antibody staining jumps from $289 internally to $473 and $514 respectively.
Large Pharma and Biotech Dominance
Multinational pharmaceutical corporations possess the capital to acquire multiple proprietary spatial systems simultaneously. These companies integrate spatial profiling directly into drug target discovery, clinical trial biomarker tracking, and safety toxicity screening pipelines.
Tier-1 Academic Institutions
Elite research universities leverage large institutional endowments, institutional equipment grants, and substantial indirect overhead reimbursement rates to maintain dedicated spatial omics core facilities. The National Science Foundation (NSF) Higher Education Research and Development (HERD) Survey for Fiscal Year 2024 showed that the top 30 institutions accounted for 42% of total academic R&D spending, giving them disproportionate access to high-end instrumentation.
Limited Access for Smaller Labs and Startups
Smaller institutions, historically underserved colleges, and early-stage drug development startups struggle with high capital equipment hurdles. Without direct access to dedicated instruments, these groups rely on external service providers or bypass spatial analysis entirely.
Role of Government-Funded Research Centers
Agencies like the National Cancer Institute (NCI) and the National Institute of Standards and Technology (NIST) play a critical role in providing shared resources. Federal intramural research programs benefit from centralized equipment purchasing, allowing government scientists to access multi-omics platforms unattainable for many extramural independent researchers.
How Cost Barriers Are Quietly Shifting Research Priorities
High operational pricing shifts scientific inquiry away from exploratory basic biology toward predictable, highly funded disease domains. Funding availability directly influences the scientific questions researchers choose to pursue.
High-ROI Research Areas and Oncology Concentration
Because spatial profiling reagents carry high ongoing costs, principal investigators prioritize indications with abundant grant funding and clear disease models that promise high returns on investment (ROI) for drug development. The National Cancer Institute (NCI) operated with a $7.22 billion budget in Fiscal Year 2024 (data from the archived FY24 NCI Budget Fact Book). This massive funding pool drives heavy spatial deployment into oncology research.
Conversely, fields like environmental health rely on smaller budgets; the National Institute of Environmental Health Sciences (NIEHS) received roughly $913.8 million in Fiscal Year 2023. Consequently, rare pediatric disorders, infectious diseases, and toxicology research experience lower spatial platform adoption due to tighter grant budgets.
Reduced Exploratory and Basic Science in Smaller Labs
High per-sample costs force researchers to utilize smaller sample sizes, reducing statistical power. Investigators favor low-risk experiments designed to yield rapid publication outcomes rather than high-risk, exploratory hypotheses that advance fundamental biological understanding.
Is Innovation Becoming Centralized in the U.S. Spatial Biology Ecosystem?
Spatial research activity displays strong geographic concentration within established U.S. life science clusters. Geographic proximity to vendors and core facilities grants distinct advantages.
Geographic Hubs and Vendor Proximity Advantages
Major life science clusters in Massachusetts, California, and New York host densely connected core laboratories, spatial vendor headquarters, and specialized bioinformaticians. This geographic concentration is directly tied to the presence of industry pioneers: Vizgen (makers of the MERSCOPE) is headquartered in Cambridge, Massachusetts; 10x Genomics (developers of Visium and Xenium) operates out of Pleasanton, in the California Bay Area; and Bruker Spatial Biology, formerly NanoString (creators of the CosMx and GeoMx platforms), is based in Seattle, Washington. Labs situated near these major life science hubs receive rapid field application support, early access to beta reagent kits, and direct instrument maintenance support. Distant academic labs face extended maintenance delays, higher freight costs for temperature-sensitive reagents, and restricted access to hands-on vendor training.
Collaboration Networks Versus Exclusion
While centralization fosters intense collaboration among localized experts, it leaves researchers in the Midwest and South struggling to participate in cutting-edge multi-omics consortiums. The lack of local infrastructure forces these researchers to ship precious tissue samples across the country, risking sample degradation.
The Rise of Access-as-a-Service Models in Spatial Biology
High capital costs created an expanding sector for outsourced spatial workflows, allowing smaller labs to bypass instrument purchases. Service providers are bridging the gap for researchers lacking million-dollar equipment budgets.
CROs and Shared Lab Models
Shared core facilities and specialized Contract Research Organizations (CROs) allow research groups to submit tissue samples for spatial processing. Industry players are recognizing this demand. Recently, Charles River Laboratories has marketed high-plex spatial pathology and proteomics services for preclinical clients, while also separately announcing an AI-driven digital pathology workflow in May 2026.
Cloud-Based Analysis Platforms
Data analysis presents a significant barrier alongside hardware acquisition. Cloud platforms enable distant researchers to run standardized spatial image segmentation and cell clustering algorithms via pay-as-you-go web interfaces, reducing local computing investments. The NIH Common Fund supports initiatives like the Human BioMolecular Atlas Program (HuBMAP), providing an open-access data portal (portal.hubmapconsortium.org) that helps external researchers analyze spatial datasets collaboratively.
Outsourcing Versus In-House Capabilities
While the high upfront price of spatial instruments dominates the conversation, our project model reveals that the real barrier to entry is the repeating per-sample charge. The machine itself accounts for under 7 percent ($15,000) of an amortized study, whereas consumables and reagents consume over 73 percent ($160,000) of the budget. Outsourcing to CROs or core facilities allows resource-constrained labs to bypass the initial capital expenditure, but it does not eliminate the crippling per-sample reagent costs. This explains exactly why shared machines alone have not solved the access problem.
Can Funding Close the Gap or Is It Reinforcing It?
Federal research grants aim to equalize scientific opportunity, yet award distribution mechanisms frequently reinforce institutional disparities.
NIH and NCI Funding Distribution
According to public statistics from the NIH RePORT database, the overall success rate for competitive Research Project Grants has fallen sharply since 2023. The system heavily favors established centers.
Preliminary Data and Grant Accessibility Challenges
Securing federal funding for spatial projects typically requires robust preliminary data demonstrating tissue quality, staining specificity, and panel multiplexing feasibility. Well-funded laboratories utilize existing spatial hardware to generate preliminary figures effortlessly. Resource-constrained investigators struggle to obtain seed funding to generate initial proof-of-concept data, creating a frustrating cycle.
Bias Toward Established Institutions
Grant review panels naturally gravitate toward proposals from institutions with proven spatial biology infrastructure. If a university lacks a dedicated spatial core facility, reviewers question the feasibility of the proposed research, further consolidating funding among elite institutions.
What This Means for Startups Versus Established Players
The financial threshold of spatial biology shapes competitive dynamics across the U.S. biotechnology commercial sector, creating distinct advantages for well-funded entities.
High Entry Barriers
Early-stage venture-backed startups operating on limited Small Business Innovation Research (SBIR) grants must deploy capital cautiously. According to current SBA guidelines and NIH funding notices, Phase I SBIR grants cap at approximately $306,872. Allocating this entire grant toward a single spatial instrument would consume the entire award, forcing early startups to rely heavily on third-party service providers..
Innovation Versus Scalability Trade-Offs
Startups often possess agile, highly focused hypotheses for novel drug targets but lack the internal spatial infrastructure to validate them rapidly. Conversely, established pharmaceutical companies possess the infrastructure to scale spatial biology across thousands of samples but move more slowly structurally.
Dependence on Partnerships
To navigate high pricing, emerging biotechnology firms build strategic partnerships with instrument vendors. Manufacturers frequently collaborate with selected startups, offering access to high-multiplex instruments in exchange for validated clinical sample testing and co-marketing case studies.
Are We Heading Toward a Two-Speed Innovation Cycle?
While empirical metrics directly linking spatial hardware expenditure to long-term publication or patent output remain unmeasured, largely because academic publication cycles lag instrument acquisition by several years, the current cost structure risks producing a two-speed innovation cycle across American biomedical science.
Potential Divergence Between Well-Funded and Resource-Limited Players
Under this potential mechanism, elite centers equipped with spatial hardware, enterprise computational storage, and dedicated bioinformaticians would be expected to publish multi-omics studies, identify novel therapeutic targets, and secure follow-on funding at an accelerated pace. Conversely, institutions lacking dedicated spatial access must depend on traditional bulk transcriptomics or delayed CRO turnaround schedules. Over time, this speed differential risks concentrating scientific leadership and patent generation within a handful of elite centers.
Furthermore, if spatial discoveries remain primarily confined to well-funded disease domains like oncology, advancements in underfunded fields risk lagging behind. This divergence could ultimately delay the development of precision medicine therapies for rare or neglected disorders, impacting long-term healthcare equity across diverse populations.
What Needs to Change to Democratize Spatial Biology?
Opening access to spatial omics requires concerted action from federal funding agencies, technology developers, and scientific consortia to lower entry barriers.
Cost Reduction via Technology Scaling
Instrument vendors must expand platform adoption by engineering low-cost assay formats, reusable probe panels, and microfluidic volumes scaled for smaller tissue sections. Bringing per-slide reagent expenses down toward traditional bulk sequencing prices will increase adoption across smaller laboratories.
Policy and Funding Restructuring
Expanding federal shared instrumentation programs offers a path forward. The NIH Office of Research Infrastructure Programs (ORIP) manages the S10 Shared Instrumentation Grant program, providing awards for shared research equipment. Targeting S10 funding allocations at regional research consortiums will allow smaller institutions to pool resources and access spatial hardware collectively. However, since pooling money for hardware only addresses roughly 7 percent of the total project expense, funding mechanisms must also be restructured to subsidize the much steeper per-sample rates that keep these workflows out of reach.
Open-Source and Collaborative Ecosystems
Community-driven open-source projects establish standardized data structures and open-access algorithms. The 2022 White House Office of Science and Technology Policy (OSTP) public-access memorandum on 'Ensuring Free, Immediate, and Equitable Access to Federally Funded Research' directed federal agencies to support open science frameworks. Publicly accessible reference maps permit small labs to perform comparative spatial analyses independent of expensive raw reference dataset generation.
Standardization and Interoperability
Creating interoperable file formats ensures researchers can mix and match analysis software, breaking vendor lock-in. When data formats become standardized, smaller labs can utilize free academic bioinformatics tools rather than paying expensive commercial software licensing fees.
Innovation Versus Accessibility: Can the U.S. Balance Both?
Spatial omics represents an extraordinary advance in tissue biology, offering unprecedented spatial resolution into disease mechanisms. The tension between high platform costs and widespread scientific innovation remains a central challenge. As detailed in Kings Research’s U.S. Spatial Biology Market Report, the U.S. spatial biology sector expands robustly toward projected billion-dollar valuations, but long-term leadership depends on broad technology access.
Ensuring that regional universities, independent research centers, and early-stage biotechnology startups possess affordable pathways to spatial tools is vital. Balancing financial realities with equitable access will ultimately determine the future pace of American scientific discovery, ensuring precision medicine reaches all facets of healthcare.
Whether you are an industry executive, commercial strategist, investor, or academic investigator seeking to navigate these trends, gain a comprehensive understanding of the financial dynamics, growth drivers, and institutional trends defining the American life sciences ecosystem. To explore detailed projections, pricing analyses, and market forecasts through 2033, access the complete study in the U.S. Spatial Biology Market Report from Kings Research.
Frequently Asked Questions
Why is spatial biology so expensive?
The highest financial barrier in spatial biology is the recurring per-sample reagent cost, with proprietary high-multiplex kits and consumables dominating project budgets. Second to this are the high capital instrument costs ($300,000 to $750,000) driven by integrated optical hardware and microfluidics. Additionally, intensive data storage demands and specialized bioinformatics talent contribute to substantial upfront and ongoing laboratory expenditures.
Can small labs access spatial omics technologies?
Small laboratories access spatial technologies primarily through regional university core facilities, collaborative research networks, or specialized CRO service models. Federal grants like the NIH S10 Shared Instrumentation Program also help regional institutions acquire shared hardware. However, this access often comes at a premium for external researchers. For example, a February 2026 price list from the University of Georgia's spatial biology facility shows outside users paying $78.13 an hour for machine time compared to $34.53 for in-house users, and $769.66 per slide against the internal rate of $669.27.
What is the average cost per sample?
Average reagent-only expenses range between $1,200 and $4,500 per sample slide depending on target panel depth and resolution limits. Full-service rates through core facilities or commercial service providers add substantial processing, tissue preparation, and custom bioinformatics fees on top of base consumables.
What affordable alternatives exist?
Researchers frequently rely on traditional immunohistochemistry or bulk RNA sequencing as budget-friendly alternatives. Additionally, collaborating with academic core facilities or utilizing pay-as-you-go cloud platforms for data analysis helps minimize massive upfront capital investments.
How does cost impact innovation speed?
High costs restrict spatial assays to well-funded laboratories, creating a two-speed research environment. Elite institutions with direct instrument access generate preliminary data and publish findings rapidly, whereas smaller labs face financial delays or depend on slower external service queues.