


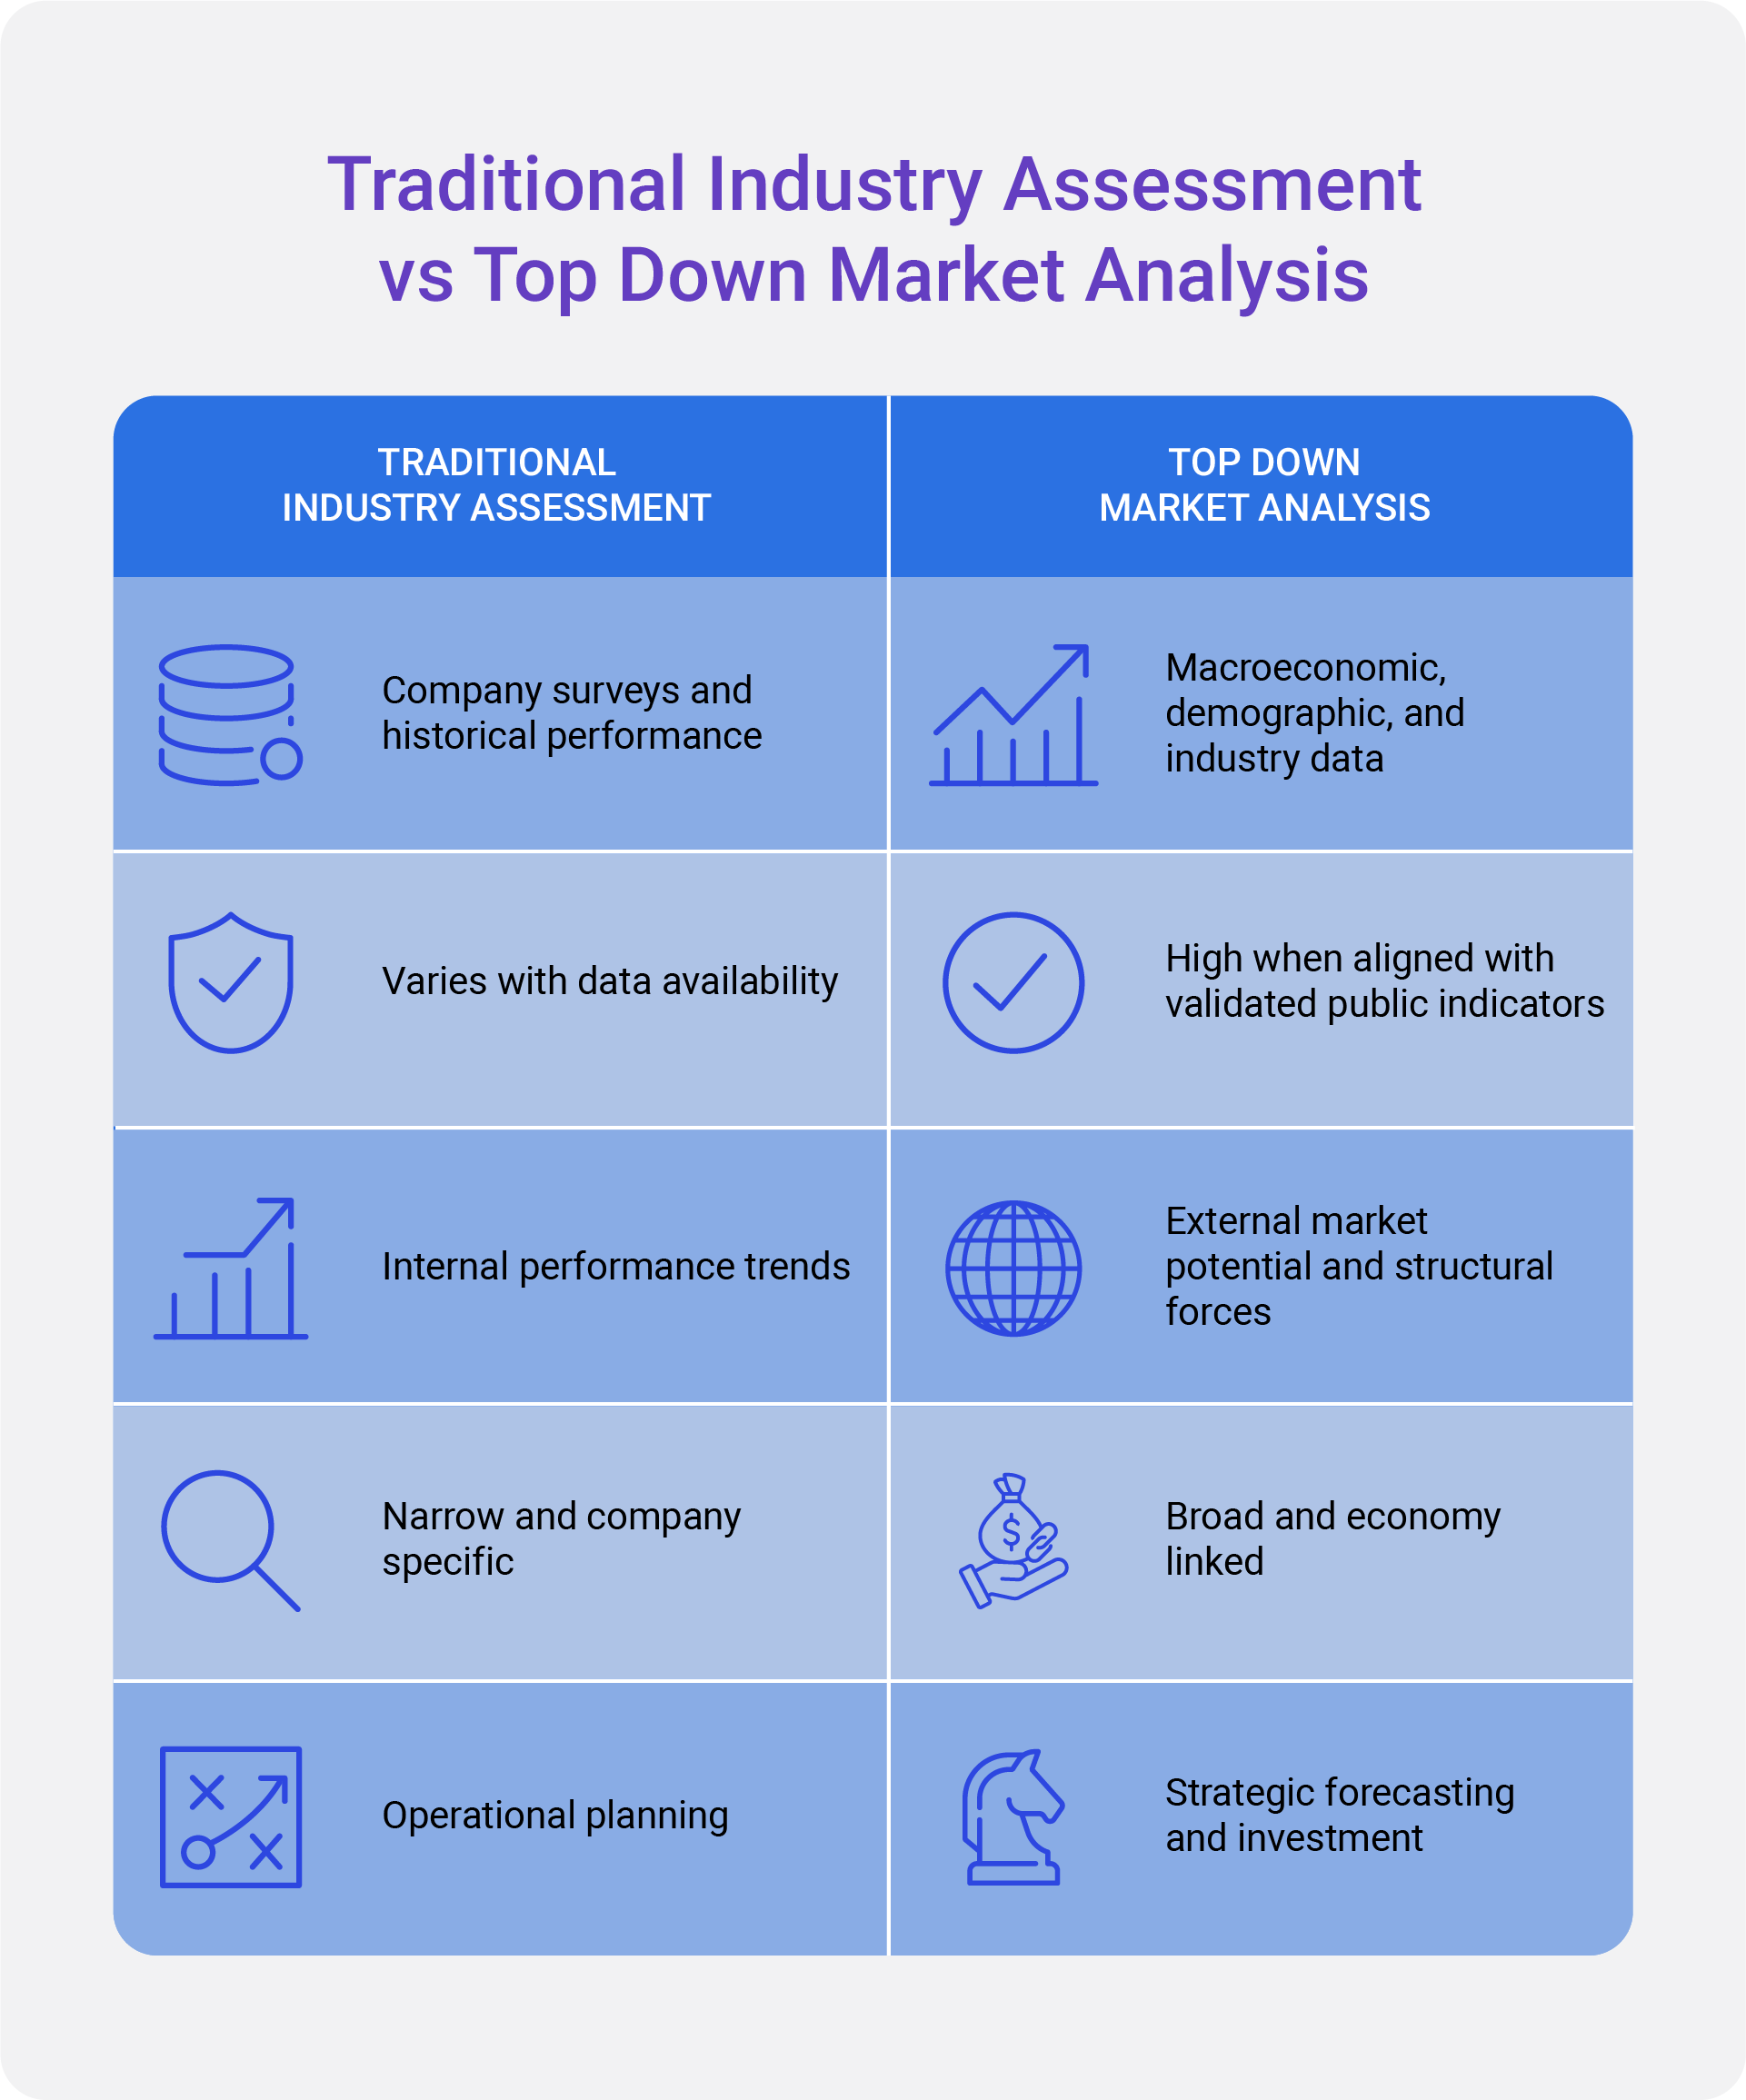
Top down market analysis is one of the foundational approaches used in market research to understand the true scale, maturity, and potential of an industry. It begins by examining broad macroeconomic, demographic, and sector level indicators and then narrows the view to define TAM, SAM, and SOM with measurable precision. For leaders who need reliable forecasts, top down analysis provides structure, comparability, and clear logic in how market boundaries are defined.
In a landscape where industries evolve quickly and competitive signals shift without warning, top down frameworks help research teams ground projections in verified data and transparent methodology. As organizations rely more heavily on evidence based planning, this approach forms the backbone of market sizing, investment evaluation, and long term strategic assessment.
Why Top Down Analysis Matters for Market Forecasting
Top down analysis improves forecast reliability because it starts with validated macro indicators rather than fragmented assumptions. By drawing from economic data, sector performance, consumption patterns, and international benchmarks, analysts can establish a strong baseline for market potential.
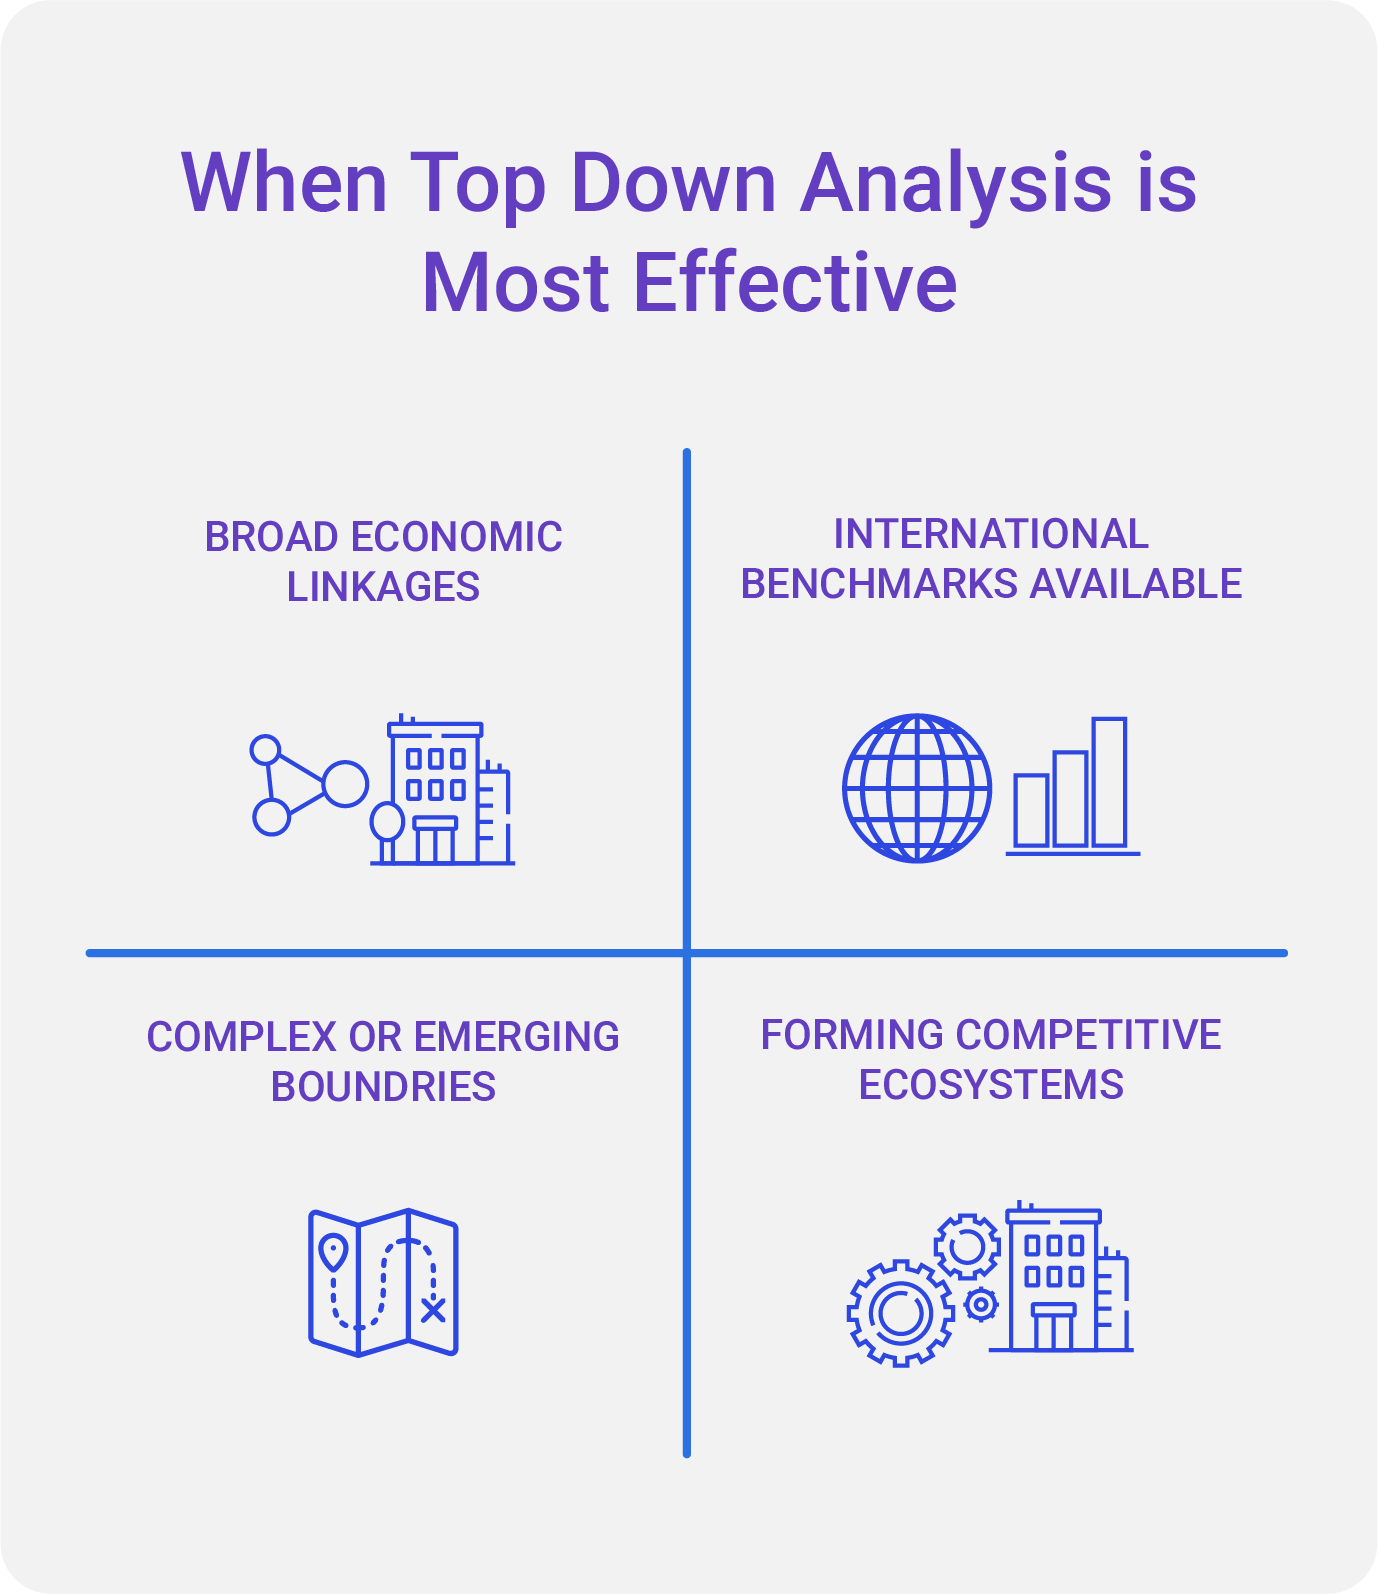
This approach is particularly effective when:
- Industries have broad economic linkages.
- Comparable international benchmarks exist.
- Market boundaries are complex or emerging.
- Competitive ecosystems are still forming.
Understanding the TAM, SAM, and SOM Framework
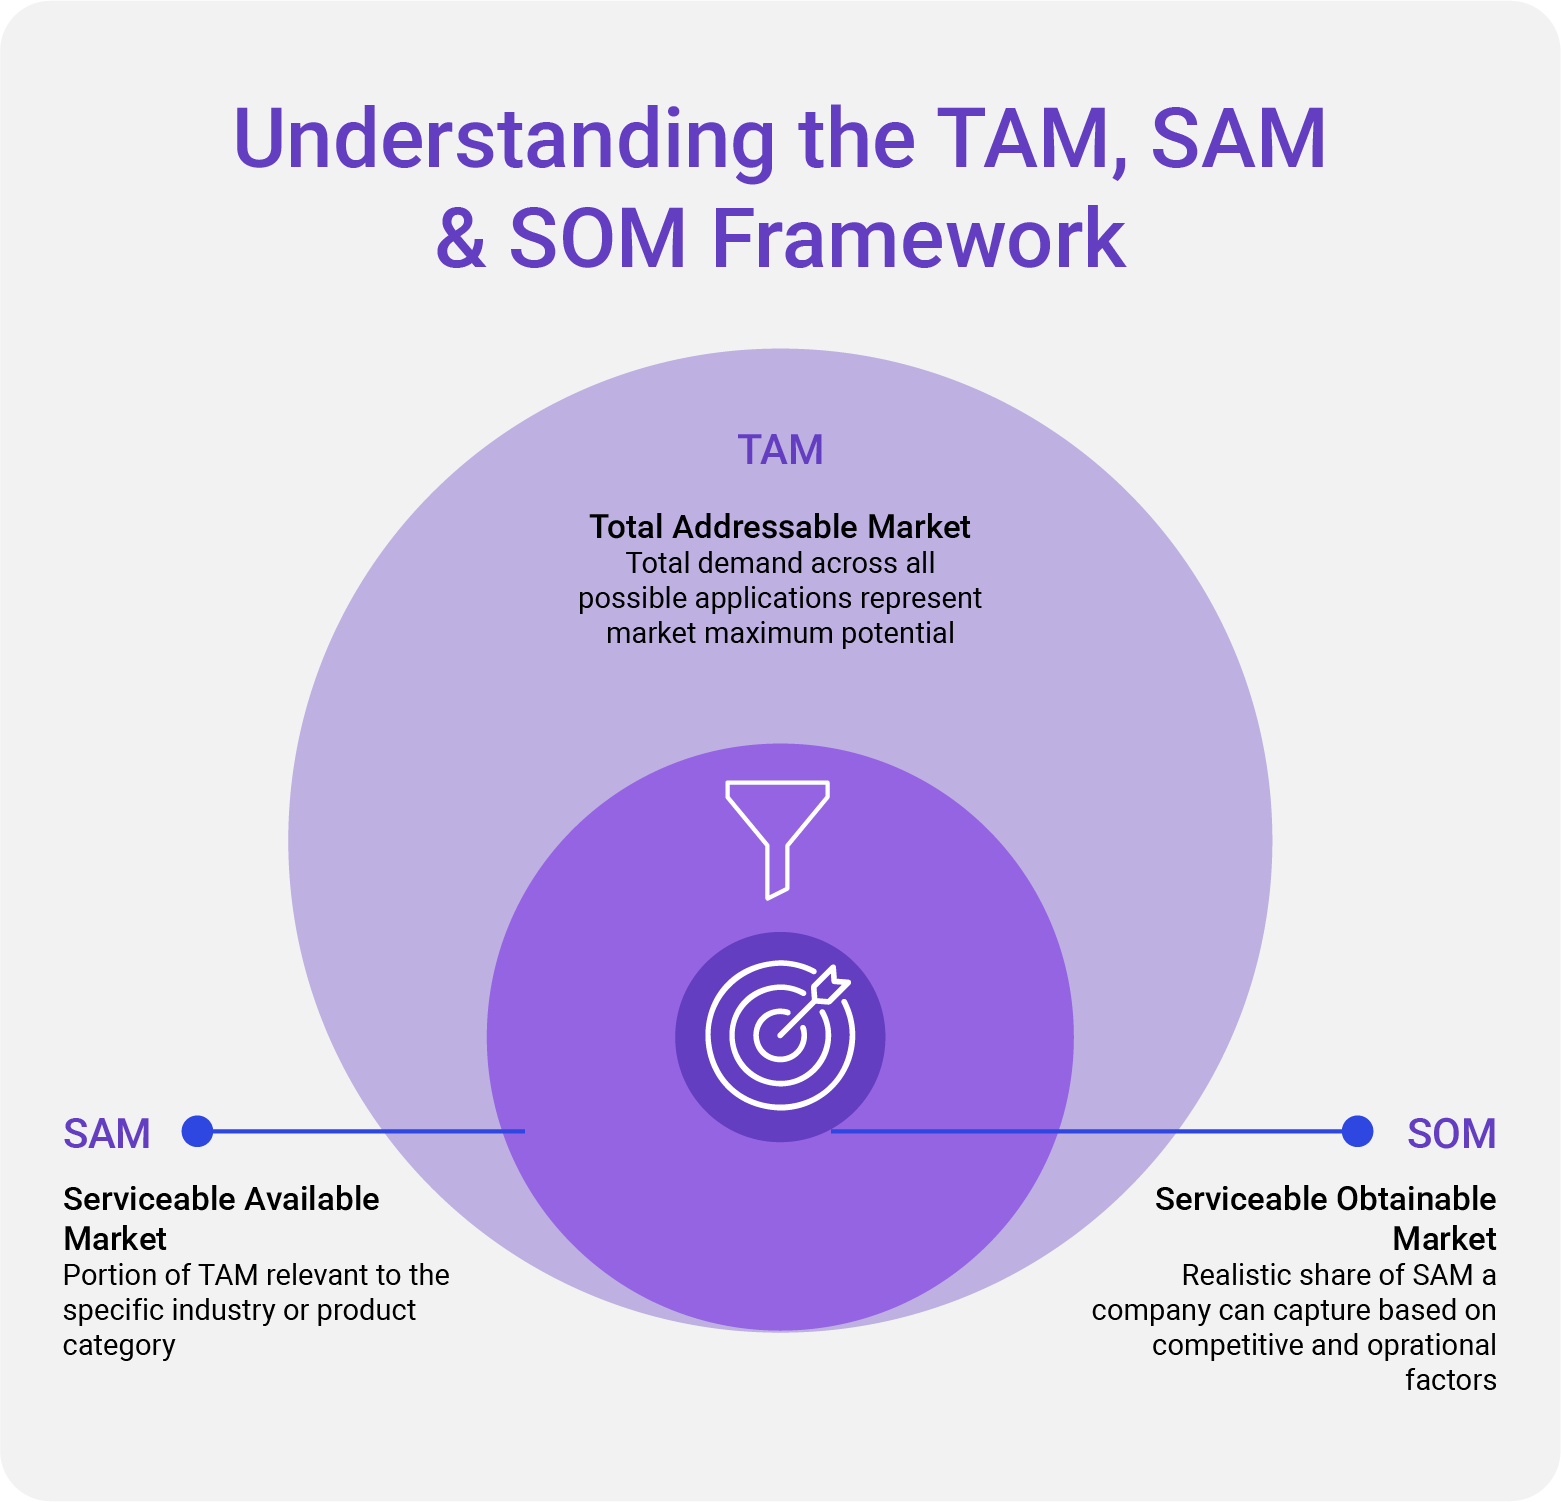
The TAM SAM SOM model is central to top down market sizing. It enables analysts to move from the broadest possible market definition to the segment that is realistically addressable by a specific solution.
- Total Addressable Market (TAM)
The total demand for a product or service across all possible applications in the global or regional economy. It reflects maximum potential without constraints.
- Serviceable Available Market (SAM)
The portion of TAM that aligns with the specific characteristics of the industry or product category being analyzed. It excludes segments that fall outside the functional scope.
- Serviceable Obtainable Market (SOM)
The realistic share of the SAM that a company or solution can capture within a defined timeframe, based on factors such as competitive intensity, regulatory constraints, and channel access.
In top down analysis, TAM and SAM are primarily quantified using macro indicators and industry benchmarks, while SOM is refined using competitive and operational insights.
A Step-by-Step Guide to Top down Market Analysis
Step 1: Identification of the Market Boundary
Analysts begin by defining the exact scope of the market. This includes identifying:
- Relevant product and service categories
- Inclusion and exclusion criteria
- Value chain positioning
- Geographic boundaries
Analysts examine the full range of products and services associated with the sector and determine which elements fall within the intended scope. This involves clarifying functional criteria, mapping the value chain from production to consumption, and identifying the geographies that meaningfully influence demand. Through this process, the research team ensures the market is neither overextended nor artificially narrowed, creating a precise foundation for all subsequent sizing and forecasting.
Step 2: Assessment of Macroeconomic and Industry-Level Indicators
Once the boundary is defined, analysts compile the macroeconomic and sector-level indicators that influence the scale of the industry. These inputs typically include the contribution of relevant sectors to GDP, consumption trends, infrastructure activity, technology penetration, and regional trade flows.
These factors reveal the external economic drivers that shape market behavior. By anchoring the analysis in verified macro-level evidence, researchers establish a reliable baseline from which to estimate total market potential and future growth prospects. For a detailed view of how Kings Research structures its macro-indicator driven methodology, see our research process.
Step 3: Application of Industry Ratios and Benchmark Comparisons
Top down models use ratios derived from established benchmarks. Examples include
- Revenue as a percentage of sector GDP
- Adoption rates based on comparable markets
- Per capita consumption values
Output per employee or unit
Analysts convert broad indicators into specific market estimates through industry ratios and benchmarking. These comparisons draw on metrics such as revenue as a share of sector GDP, per capita consumption patterns, adoption curves in reference markets, and productivity ratios.
Benchmarking helps ensure that the resulting market size aligns with observable structural relationships rather than speculative assumptions. This approach enhances comparability across markets and provides a more systematic basis for understanding industry scale.
Step 4: Segmentation to Derive the Serviceable Available Market
After determining the total addressable market, the analysis progresses into segmentation. Analysts identify which portions of the broader market align with the research focus by examining verticals, customer groups, technology categories, pricing tiers, and geographic divisions.
This segmentation process filters out irrelevant segments and narrows the market to its serviceable components. By refining TAM into SAM, the analysis transitions from high-level economic potential to the portion of demand that directly corresponds to the intended application.
Segmentation criteria include:
- Industry verticals
- Technology categories
- Customer groups
- Price ranges
- Geographic divisions
This process eliminates irrelevant segments and refines SAM into a focused view of the true serviceable market.
Step 5: Interpretation of Competitive Dynamics to Estimate SOM
The next stage connects top down analysis with competitive intelligence to determine the realistic capture potential. Analysts evaluate market conditions such as competitive positioning, penetration levels, distribution reach, regulatory environments, and customer acquisition constraints.
These insights reveal how competitive forces limit or expand access to demand within the serviceable market. The resulting SOM reflects the portion of the market that can be attained under current competitive conditions, providing a grounded view of achievable opportunity rather than an inflated theoretical estimate.
Analysts evaluate:
- Competitive landscape
- Market penetration levels
- Distribution reach
- Regulatory factors
- Customer acquisition barriers
By applying these constraints, the SOM reflects a realistic capture potential rather than an inflated projection.
Step 6: Triangulation for Model Validation
The final step involves validating the analysis through data triangulation. Analysts compare top down results with bottom up estimates, primary research findings, historical performance data, and external benchmarks. Any discrepancies are examined to ensure that assumptions and structural relationships remain consistent across evidence sources. This verification process reinforces the analytical integrity of the forecast and ensures the final market estimate reflects real world dynamics and defensible logic.
Top down results are validated by cross checking with:
- Bottom up estimates
- Primary research insights
- Historical industry performance
- Independent benchmarks
This validation step ensures that the top down forecast is defensible and aligned with real world dynamics.
How Top Down Analysis Strengthens Industry Forecasts
Top down analysis enhances forecasting accuracy by anchoring predictions to structural forces that shape market expansion. Rather than relying on fragmented datapoints, analysts interpret growth through economic cycles, sector performance, and cross-market comparisons.
Key advantages include:
- Ability to model scenarios under different economic conditions.
- Strong comparability across global regions.
- Reduced vulnerability to short-term fluctuations.
- Clear justification for forecast assumptions.
This approach gives executives confidence that forecasts reflect real constraints and opportunities rather than isolated datapoints.
Using Top Down Analysis for Scenario Building
Top down methodologies are well suited for scenario analysis because they start from macro conditions that influence market direction. Analysts can test scenarios such as:
- High growth markets driven by consumption or policy shifts.
- Moderate growth markets impacted by supply chain constraints.
- Low growth markets constrained by economic slowdown.
Each scenario adjusts key structural variables, enabling strategic teams to understand how the market might behave under different conditions.
The Kings Research View: Why Top Down Analysis Matters
At Kings Research, top down analysis is treated as an essential pillar of industry forecasting. Our analysts use global economic datasets, sector level indicators, and verified benchmarks to define the structural potential of each market. This approach ensures that every forecast we deliver has a transparent baseline rooted in objective economic evidence.
When combined with bottom up intelligence, primary research, and triangulation frameworks, top down methodology allows Kings Research to produce forecasts that are both comprehensive and strategically actionable. This alignment between macro indicators and competitive insights helps clients plan investments, evaluate opportunities, and allocate resources with precision.
Conclusion
Top down market analysis provides a disciplined and structured way to understand industry potential. It allows research firms to ground forecasts in economic fundamentals and align projections with verified external indicators. As business leaders navigate increasingly complex global markets, top down approaches remain essential for clarifying opportunity size, guiding strategic decisions, and building long-term confidence in forecasting outcomes.


