


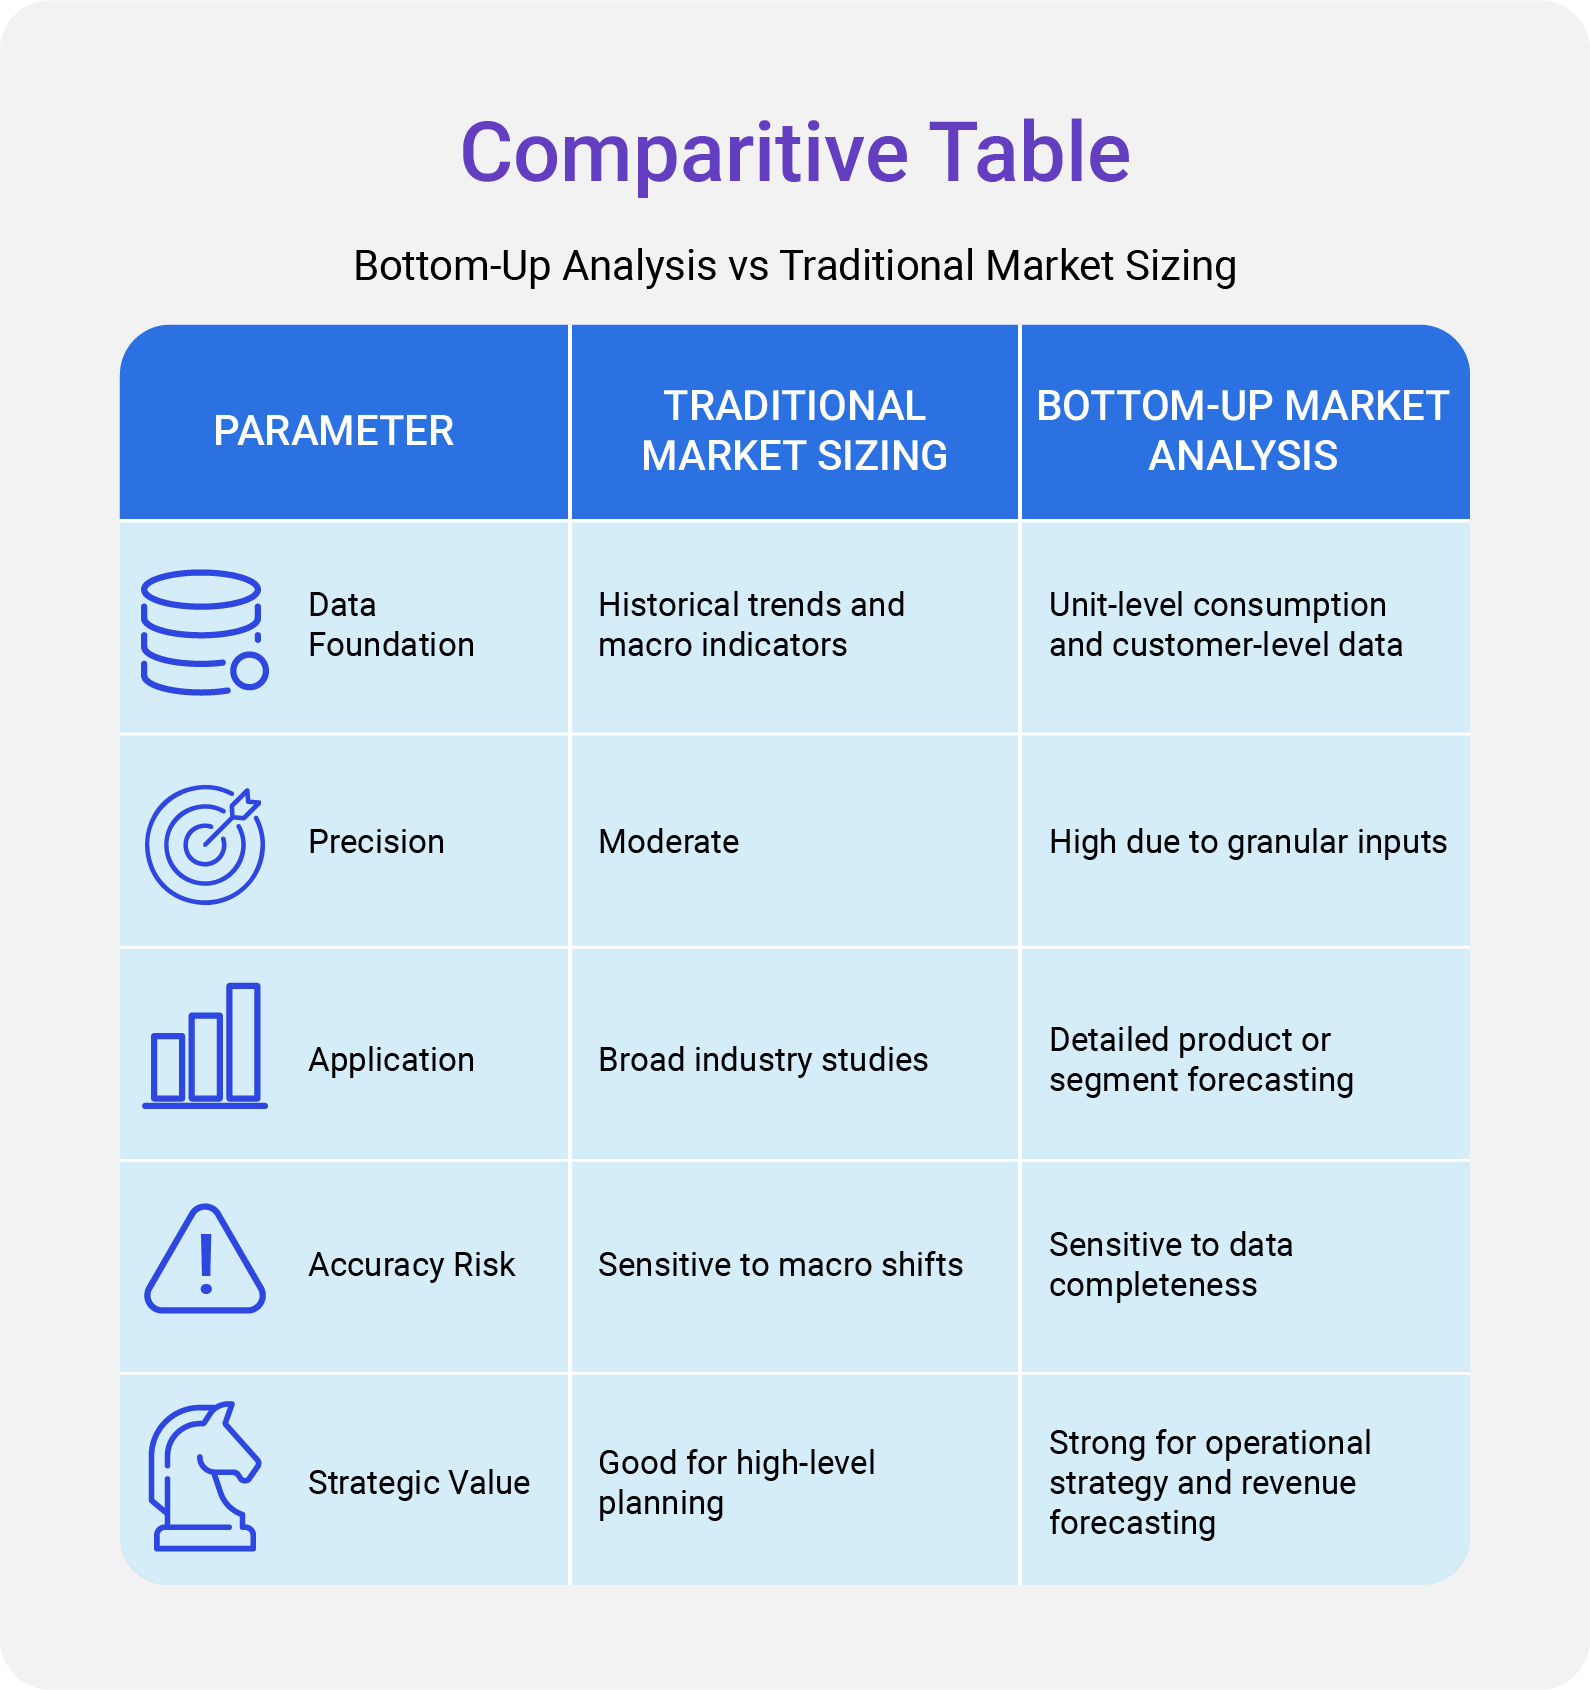
Bottom up market analysis is one of the most precise and evidence driven methods used in modern market research. Unlike top down frameworks that begin with macroeconomic indicators, the bottom up approach builds market size from individual units, customer segments, and transaction volumes. This method reflects actual market activity and enables analysts to quantify demand with a high level of granularity.
In industries where customer behavior, product adoption, or operational capacity determines market performance, bottom up forecasting delivers reliable insights grounded in measurable data. As businesses seek deeper accuracy for investment, strategy, and resource planning, bottom up models have become central to forecasting methodologies across research firms.
How Bottom Up Market Analysis Improves Forecast Accuracy
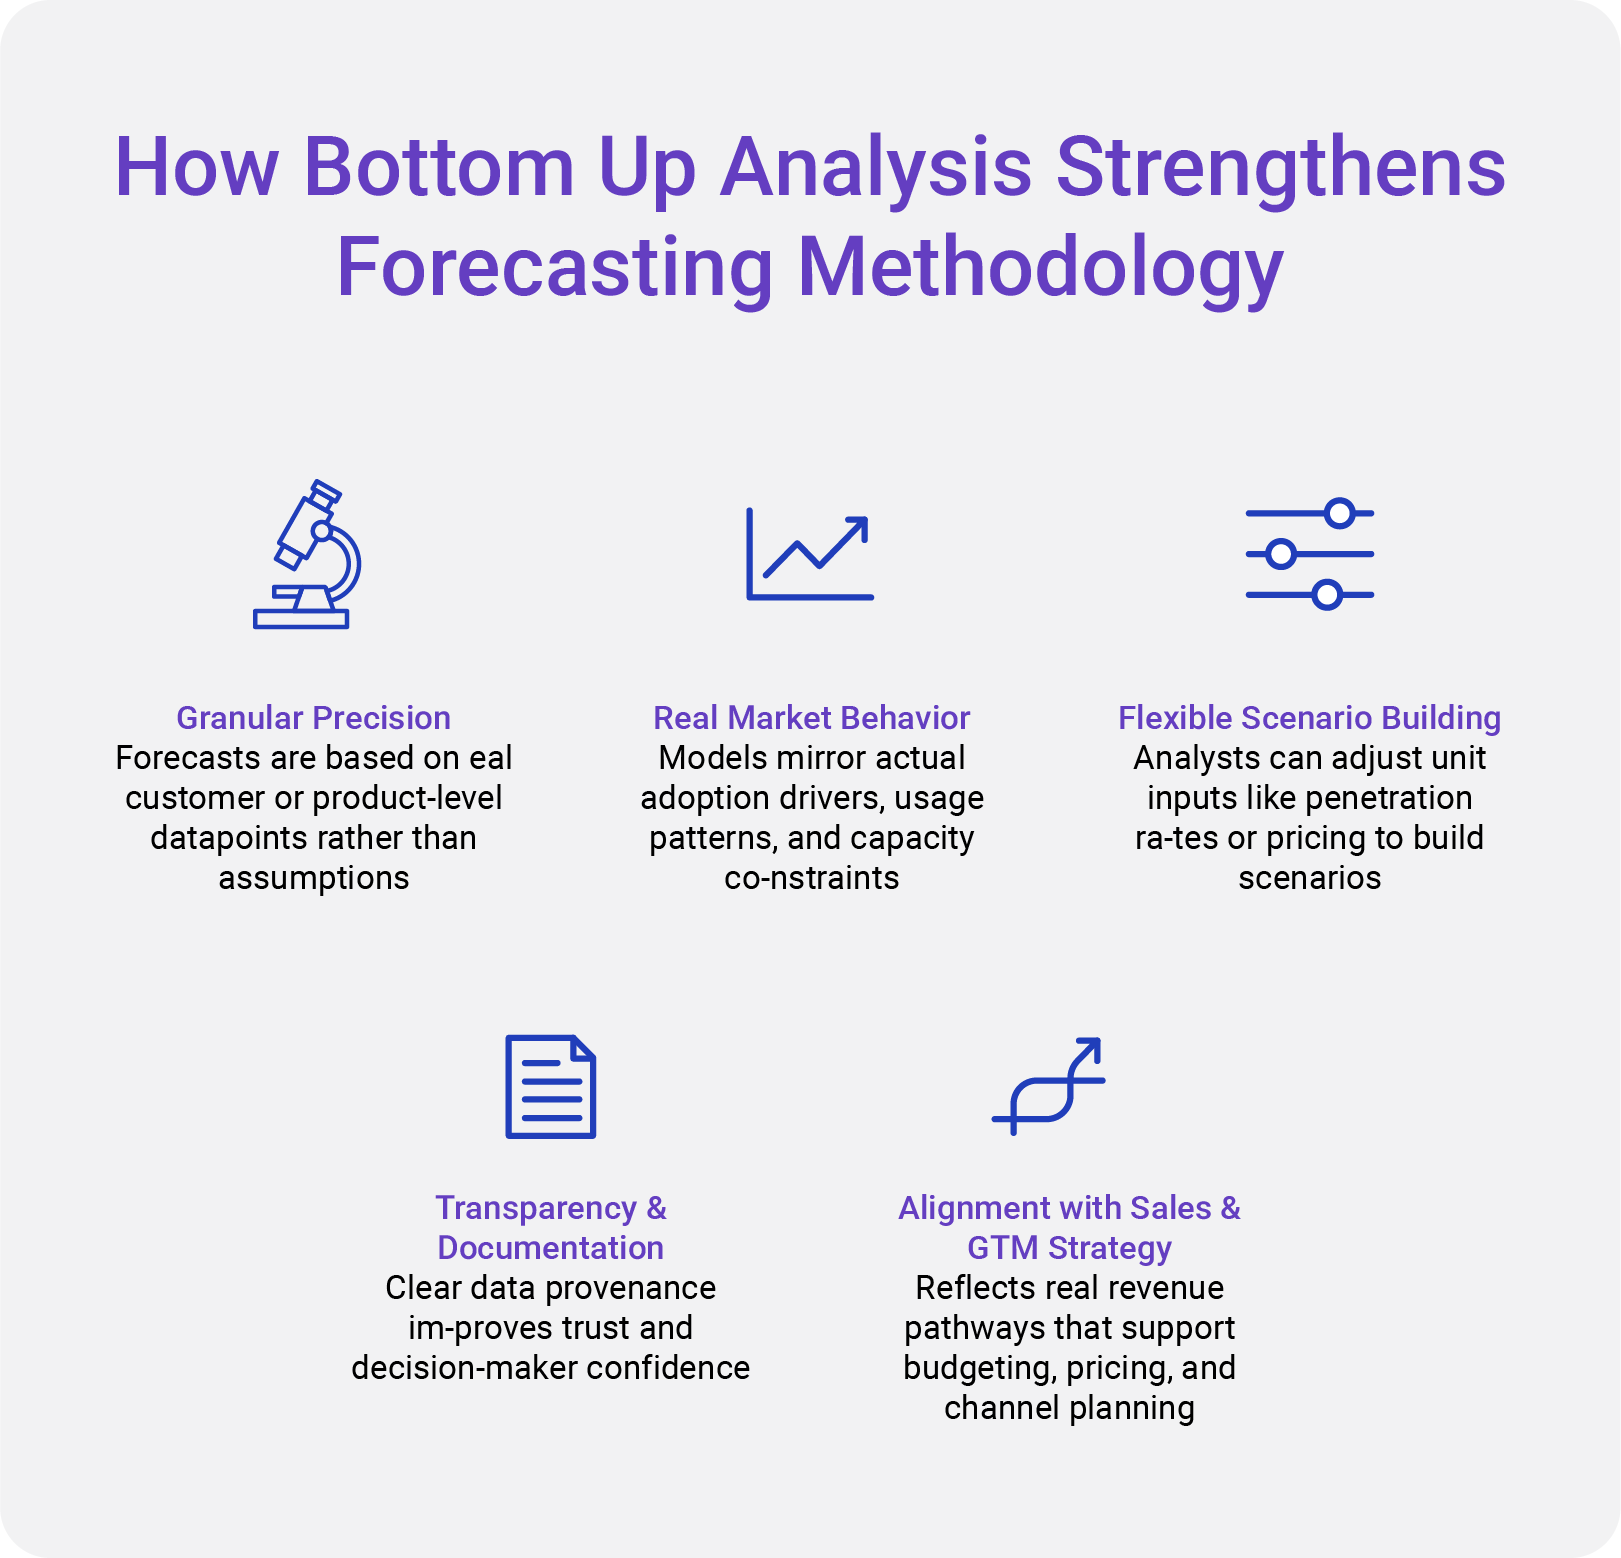
Forecasting reliability improves when models are built from real units of demand. Bottom up analysis collects data at the lowest possible level and aggregates it to define the true size and trajectory of the market. Bottom up methods allow analysts to reflect operational constraints, supply side capacity, and real world customer behavior, resulting in forecasts that align more closely with observed performance. This approach is valuable when:
- Market demand varies widely by application or region.
- Adoption depends on customer specific characteristics.
- Industry data is fragmented or not publicly reported.
- Competitive penetration influences actual attainable market share.
Understanding the Bottom Up Market Analysis Framework
Bottom up market forecasting relies on three foundational components.
- Unit Level Demand: Analysts begin by calculating the number of units consumed, produced, or deployed at the customer or operational level. These units are then multiplied by relevant pricing or value metrics.
- Customer and Segment Granularity: Segment level differentiation strengthens data accuracy. Each customer group may have distinct adoption rates, spending capacity, and usage frequency. Segmentation refines estimates across industries, applications, and regions.
- Aggregation into Total Market Size: Once all micro level inputs are captured, analysts aggregate the data to estimate total market value. This produces a market size grounded in direct observations rather than top down ratios or macro assumptions.
A Step-by-Step Guide to Bottom Up Market Analysis
Step 1: Defining Market Segments and Use Cases
Bottom up market analysis begins with a precise definition of the market segments and the specific use cases that shape how demand is formed. Analysts examine the industry categories, application areas, customer groups, price bands, regional markets, and operating models that influence purchasing behavior. This step establishes the structural foundation of the analysis because it determines how demand will be attributed and how unit level activity will be interpreted later in the process.
Clear segmentation prevents the blending of unrelated demand sources and ensures that the forecast reflects the true diversity of adoption patterns across the market. By approaching segmentation as an analytical exercise, research teams create a framework that supports accurate unit counts, consistent pricing logic, and a defensible market size.
Step 2: Collecting Unit Level Data
Once the segmentation structure is established, the next task is gathering the unit level data that forms the core of bottom up modeling. Research teams compile evidence from primary surveys, vendor shipment figures, distributor sales patterns, technology adoption statistics, industry repositories, and operational capacity indicators. These data points reveal how many units are produced, sold, installed, or consumed within each segment.
Since bottom up analysis relies on the accumulation of these granular inputs, the quality of this step directly determines the accuracy of the entire model. The transition from raw data to structured unit counts requires careful validation and alignment across sources to avoid duplication or misclassification.
Step 3: Determining Pricing or Value per Unit
After establishing unit volumes, analysts determine the monetary value associated with each unit to calculate the economic contribution of every segment. This requires an assessment of average selling prices, subscription fee structures, licensing frameworks, service margins, and operating costs that influence total revenue.
The goal is to understand not just what is being sold but how value is generated within each segment. When unit counts are paired with accurate pricing information, analysts can translate operational activity into financial estimates that reflect real market conditions. This conversion step is critical because it bridges the gap between physical units and economic value.
Step 4: Aggregating Segment Totals to Estimate Market Size
With unit values calculated for each segment, analysts combine the segment level totals to determine the overall market size for the base year. The aggregation process clarifies how each segment contributes to total market value and reveals structural patterns such as concentration, fragmentation, or emerging high growth clusters.
Calculating each segment independently ensures that the final market size is built on measurable evidence rather than broad assumptions. This approach provides a clear picture of present market structure and supports more accurate comparisons across regions, applications, or customer groups.
Step 5: Modeling Growth Based on Real Adoption and Operational Behavior
Forecasting future demand requires understanding how unit level behavior evolves over time. Analysts examine annual unit growth, adoption curves, replacement cycles, churn patterns, capacity expansion activities, and pipeline behavior to determine how each segment will grow. Because this approach relies on actual behavioral and operational indicators rather than high level macro projections, it produces forecasts that align more closely with real market dynamics.
The objective is to model how much the market will grow and why that growth will occur. This behavioral grounding gives bottom up forecasts higher predictive strength compared to traditional top down projections.
Step 6: Validating Through Triangulation and External Benchmarks
The final step involves validating the entire model through triangulation to ensure credibility and accuracy. Analysts compare bottom up results with top down estimates, historical performance, industry benchmarks, and insights gathered from channel partners or operational stakeholders. This validation process tests the coherence of the model and identifies areas where adjustments may be required.
Effective triangulation strengthens confidence in the forecast by demonstrating that the output remains consistent with independent reference points. This step is essential as it transforms a set of calculations into a forecast that can withstand executive level scrutiny and support high stakes decision-making.
Common Data Sources for Bottom Up Market Sizing
Accurate bottom up models rely on diverse and high quality data inputs. Common data sources include:
- Primary surveys of customers and vendors
- Interviews with distributors and system integrators
- Company reports and shipment disclosures
- Operational metrics from facilities or plants
- Government production and import records
- Industry association databases
- Technology usage and adoption surveys
Why Bottom Up Analysis Matters, The Kings Research View
At Kings Research, bottom up analysis is an essential component of our forecasting methodology. Our teams collect detailed unit level data across industries, examine adoption drivers, and apply structured segmentation to produce accurate and practical forecasts.
Bottom up analysis forms the basis of operational insights, revenue projections, and segment level demand assessments. When paired with triangulation and top down validation, it ensures every forecast is evidence based, transparent, and strategically aligned with real market conditions.
Conclusion
Bottom up market analysis delivers unmatched precision by grounding forecasts in actual customer, product, and operational data. It helps research firms capture real demand behavior, identify growth pockets, and provide clients with clear and defensible insights. As industries become more data driven and competitive landscapes evolve quickly, bottom up analysis remains a cornerstone of forecasting methodologies that leaders can trust.


