

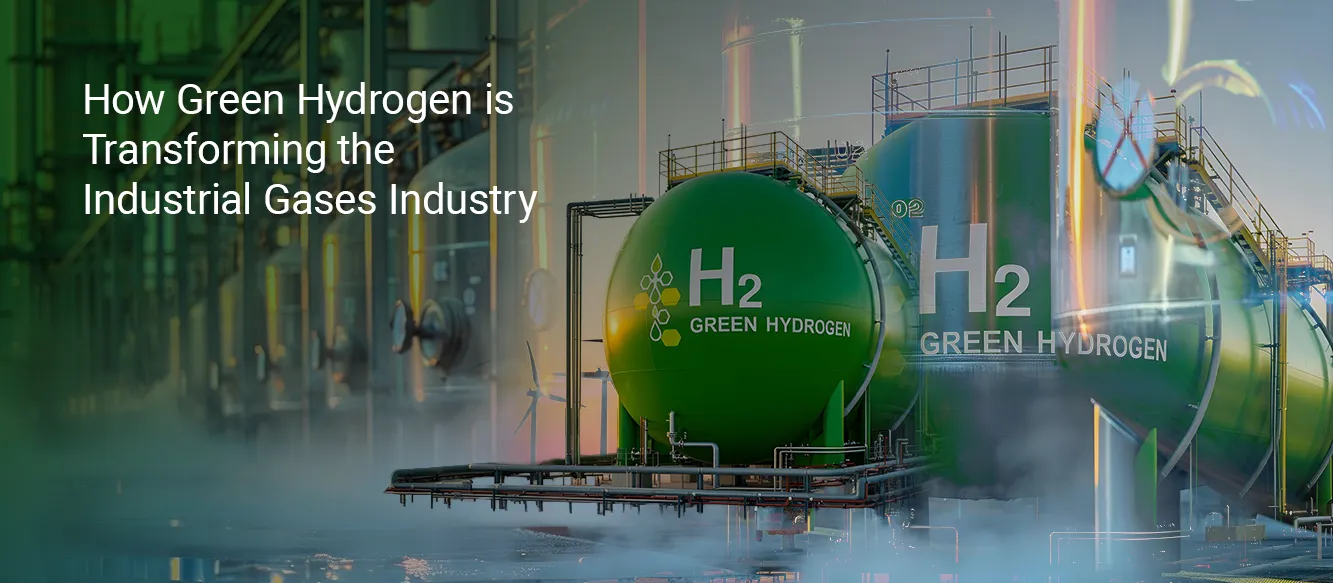
The industrial gases industry has spent the better part of a century supplying oxygen, nitrogen, argon, and hydrogen to manufacturers, refineries, hospitals, and food processors. The commercial logic was stable: produce at scale, distribute efficiently, and compete on reliability and cost. That logic is now being tested by a structural shift that goes beyond any product cycle. The decarbonization of industry is forcing the sector to confront the emissions intensity of its own most important product and to build a fundamentally different hydrogen supply chain in response.
Green hydrogen is produced through electrolysis powered by renewable electricity. It carries none of the carbon load of conventional hydrogen production. It is not yet cheap at scale, and its infrastructure remains in its early stages in most markets. But every major industrial gas supplier has made it a strategic investment priority, and governments on four continents have committed billions in public funding to accelerate its deployment. The question is no longer whether green hydrogen enters the industrial gas supply chain. The question is at what pace, under what cost conditions, and who captures the commercial position when it does.
|
Metric |
Value |
|
Global Industrial Gases Market (2025) |
USD 122.20 billion |
|
Forecast Market Size (2033) |
USD 189.42 billion |
|
CAGR (2026 to 2033) |
5.70% |
|
Largest Regional Market (2025) |
Asia Pacific, 37.60% share, USD 45.95 billion |
|
Fastest-Growing Region |
Middle East and Africa, CAGR of 6.05% |
|
Key Growth Catalyst |
Decarbonization mandates and green hydrogen adoption |
Source: Kings Research proprietary market analysis
The global industrial gases market size was valued at USD 122.20 billion in 2025 and is projected to grow from USD 128.46 billion in 2026 to USD 189.42 billion by 2033, exhibiting a CAGR of 5.70% during the forecast period. This growth is mainly driven by rising demand from industries such as healthcare, electronics, chemicals, and manufacturing, where industrial gases are essential for day-to-day operations. Download the full Kings Research Industrial Gases Market Report for detailed segmentation, competitive intelligence, and regional forecasts through 2033.
What is Green Hydrogen?
Green hydrogen is hydrogen produced through electrolysis, in which an electric current splits water into hydrogen and oxygen. When that electricity comes from renewable sources such as solar or wind power, the process produces no direct carbon emissions. The result is hydrogen that carries near-zero lifecycle carbon intensity, suitable for industrial, chemical, and energy applications.
Electrolysis is the core production process. An electrolyzer passes a direct electric current through water (H₂O), separating it into hydrogen at the cathode and oxygen at the anode. The carbon footprint of the resulting hydrogen depends entirely on the electricity source. Grid electricity from fossil fuels produces what is called grey hydrogen, even through the same electrolysis process. Only when the electricity input is certified from renewable generation does the output qualify as green hydrogen.
Industrial applications impose purity requirements that go beyond standard commercial hydrogen. Semiconductor and electronics manufacturing demands ultra-high-purity grades (typically 99.9999% or higher) that undergo additional purification steps after electrolysis. Chemical synthesis, refining, and direct reduction of iron ore tolerate slightly lower purity thresholds but require consistent pressure, volume, and composition across continuous production processes. Industrial gas suppliers managing the green hydrogen transition must address both the electrolysis infrastructure and the downstream purification, compression, and delivery systems that define industrial-grade product quality.
The Three Hydrogen Types Compared
|
Hydrogen Type |
Production Method |
Carbon Emissions |
Typical Cost (USD/kg) |
Key Applications |
Sustainability Rating |
|
Grey Hydrogen |
Steam methane reforming (SMR) or coal gasification without carbon capture |
10 to 12 kg CO₂-eq/kg H₂ (natural gas); 22 to 26 kg CO₂-eq/kg H₂ (coal) |
USD 0.5 to 1.7 |
Refining, ammonia production, chemical synthesis |
Low. No carbon mitigation. |
|
Blue Hydrogen |
SMR or coal gasification with carbon capture, utilization, and storage (CCUS) |
Reduced to 2 to 5 kg CO₂-eq/kg H₂ depending on capture rate and upstream emissions |
USD 1.0 to 2.5 |
Industrial bridge fuel, refining, power generation |
Medium. Emission reduction with residual CO₂. |
|
Green Hydrogen |
Water electrolysis powered by certified renewable electricity |
Near zero: 0 kg CO₂-eq/kg H₂ at point of generation; 0.4 to 2.7 kg CO₂-eq/kg H₂ lifecycle including asset manufacturing |
USD 5 to 7 (current); USD 1 to 2 projected by 2030 in favorable regions |
Green steel (DRI), green ammonia, clean refining, grid energy storage |
High. No direct emissions; lifecycle depends on renewable supply chain. |
Source: Emissions data per IEA Global Hydrogen Review 2024; cost data per IEA Global Hydrogen Review 2021 and DOE Hydrogen Production Cost Analysis, 2024
Why Green Hydrogen Matters to the Industrial Gases Industry
Hydrogen has been part of the industrial gases portfolio for decades. It is the third most-produced industrial gas globally by volume, consumed primarily in oil refining and chemical production. What is changing is not the product. It is the emissions liability attached to how that product is currently made.
According to the IEA’s Global Hydrogen Review 2025, hydrogen production today emits around 1.3 billion tonnes of CO₂e annually, and progress in cutting those emissions remains limited. Most emissions still come from unabated natural gas reforming and coal-based production, underscoring the need for much faster growth in low-emissions hydrogen.
This emissions profile is incompatible with the industrial net-zero commitments now required of major manufacturers by their customers, their regulators, and their capital providers. As industrial customers across steel, chemicals, and refining commit to Scope 1 and Scope 2 decarbonization targets, the emissions intensity of their hydrogen supply becomes a procurement issue, not just an environmental one. Industrial gas suppliers who cannot provide low-carbon hydrogen are at structural risk of losing supply contracts to those who can.
The commercial response has been decisive. Major industrial gas companies, including Linde PLC, Air Liquide, and Air Products and Chemicals, Inc., have made green and low-carbon hydrogen the central axis of their growth strategy. This is not a sustainability positioning exercise. It is a direct response to the recognition that industrial customers are moving toward procurement requirements that existing grey hydrogen supply chains cannot meet.
Why industrial gas companies are prioritizing green hydrogen:
- Industrial customers face regulatory and investor pressure to document and reduce Scope 3 supply chain emissions
- Grey hydrogen's 10 to 26 kg CO₂/kg emissions profile is incompatible with net-zero manufacturing commitments
- Carbon pricing mechanisms such as the EU Emissions Trading System make high-carbon feedstocks progressively more expensive
- Green hydrogen production creates a new, differentiated service line that commands premium pricing during the transition period
- Early infrastructure investment secures long-term supply contracts with anchor industrial customers before competitors establish a position
How Green Hydrogen Fits Into the Industrial Gas Value Chain
Industrial gas suppliers do not simply produce a commodity and sell it. They manage integrated value chains that include production, purification, compression, liquefaction, storage, and merchant distribution. Both on-site generation models for large industrial customers and merchant supply models for smaller buyers are part of that portfolio. Green hydrogen requires the same full-chain capability, with the production asset (an electrolyzer connected to a renewable power source) substituting for the reformer at the upstream end.
The Green Hydrogen Supply Chain
|
Step |
Description |
|
Renewable Energy |
Solar / Wind / Hydropower |
|
Electrolysis |
Water Splitting (H₂O → H₂ + O) |
|
Purification |
Processing to industrial or ultra-high-purity grade |
|
Compression or Liquefaction |
Compression or Liquefaction |
|
Storage |
On-site or bulk terminal |
|
Distribution |
Pipeline, tube trailer, or cryogenic tanker |
|
Industrial End Users |
Steel, chemicals, refining, electronics, utilities |
Monetization occurs across every stage of this chain. Industrial gas suppliers earn from the production asset (often structured as a long-term on-site supply contract or tolling arrangement), from the purification and conditioning services that bring raw electrolytic hydrogen to industrial-grade specification, from storage and logistics infrastructure, and from the merchant market premium that clean hydrogen commands over conventional supply. Suppliers who control the full chain, from renewable power procurement through delivery, capture the widest margin. Those who specialize in distribution or storage serve as infrastructure partners to producers who lack logistics reach.
The transition also creates an opportunity for an oxygen co-product. Electrolysis produces oxygen in stoichiometric proportion to hydrogen. Industrial gas suppliers who can monetize the electrolytic oxygen output through industrial or medical supply contracts improve the overall project economics of green hydrogen plants, effectively subsidizing the hydrogen unit cost through oxygen revenue.
Key Industries Driving Green Hydrogen Demand
Green hydrogen demand is not uniform across industrial sectors. Each sector has distinct application requirements, cost thresholds, and decarbonization timelines that shape both the pace of adoption and the technical specifications that industrial gas suppliers must meet.
Steel Manufacturing
Steel production through the blast furnace route is among the most carbon-intensive industrial processes, accounting for roughly 7% of global energy-sector CO₂ emissions, according to IEA data on the iron and steel sector. The hydrogen-based direct reduced iron (H₂-DRI) route offers a structural decarbonization pathway: iron ore is reduced with hydrogen rather than coke, producing iron and water instead of iron and CO₂. IEA analysis in the Breakthrough Agenda Report 2025 identifies hydrogen DRI as the preferred low-emissions option in regions with access to low-cost renewables, though early commercial plants using 100% hydrogen blends currently cost 50-140% more than conventional blast-furnace routes.
Chemicals and Fertilizers
The chemical sector is the largest industrial energy consumer globally. Ammonia production, which depends entirely on hydrogen as its feedstock, accounts for approximately half of industrial hydrogen demand in several major markets. Direct CO₂ emissions from primary chemical production have remained at approximately 935 million tonnes annually, with little progress toward decarbonization despite growing production volumes. Methanol production presents a similar pathway: green hydrogen combined with captured CO₂ produces methanol with substantially lower lifecycle emissions than conventional routes. The case for green hydrogen in chemicals is primarily economic: as carbon pricing rises and clean product premiums emerge, green ammonia and green methanol command price premiums in international trade that offset higher production costs.
Oil Refining
Refineries consume hydrogen on a significant scale for hydrodesulfurization (removing sulfur from fuels to meet fuel quality standards) and for hydrocracking heavy crude fractions into lighter, higher-value products. Today, nearly all refinery hydrogen is produced on-site by reforming natural gas. As regulators and investors press refiners to reduce their Scope 1 emissions, clean hydrogen supply contracts with industrial gas providers become a direct compliance strategy. Refiners in Europe face the most immediate pressure due to EU carbon pricing under the Emissions Trading System, making European refineries the near-term leading market for low-carbon industrial hydrogen supply.
Semiconductor and Electronics
The electronics application is structurally different from other industrial sectors. Hydrogen volumes are smaller in semiconductor manufacturing, but purity requirements are much higher: wafer fabrication typically requires ultra-high-purity hydrogen at 99.9999% (6N) or better, with advanced nodes sometimes specifying 99.99999% (7N), along with continuous monitoring and strict contamination control throughout the supply chain. The revenue premium per kilogram of ultra-high-purity hydrogen is substantially higher than for bulk industrial supply. While the announcement covers the broader ultra-high-purity gas portfolio rather than exclusively green hydrogen, it illustrates the investment scale that anchor semiconductor contracts justify and the logic of positioning production assets within semiconductor clusters.
Energy and Utilities
The grid-balancing application of hydrogen is emerging but remains in its early commercial stage. According to the IEA's Global Hydrogen Review 2024, demand for hydrogen in new applications, including energy storage, accounts for less than 1% of total global hydrogen demand, with most concentrated in road transport. The pathway to meaningful grid storage volumes runs through the cost of electrolysis at scale: when green hydrogen can be produced below USD 2/kg, it becomes competitive with several alternative grid storage technologies for long-duration applications. The timeline for that cost reduction determines the pace of utility-sector adoption.
Industry Application Comparison
|
Industry |
Primary Hydrogen Application |
Decarbonization Urgency |
Adoption Barrier |
Green H₂ Demand Horizon |
|
Steel |
Direct reduced iron (DRI) replacing coal/coke in the blast furnace route |
High. Steel accounts for 7% of global CO₂. |
H₂-DRI costs 50 to 140% more than conventional BF-BOF today |
Commercial deployments 2025 to 2030 in low-cost renewable regions |
|
Chemicals |
Green ammonia (fertilizer feedstock); green methanol |
High. Primary chemicals produce 935 Mt CO₂/year. |
Cost premium vs. grey hydrogen; demand for clean product certification |
Growing now; scaling with carbon pricing and trade premiums |
|
Oil Refining |
Hydrodesulfurization; hydrocracking |
Medium-High. ETS carbon pricing is the primary pressure in Europe. |
High existing on-site reforming capacity; switching cost |
Europe leading; wider adoption conditional on carbon price trajectory |
|
Semiconductor |
Ultra-high-purity hydrogen for wafer fabrication, etching, deposition |
Medium. Supplier ESG requirements are driving a preference for clean supply. |
Purity and supply security requirements add process complexity |
Incremental adoption where a renewable supply chain is established |
|
Energy / Utilities |
Long-duration grid storage; power-to-gas; synthetic fuel production |
Emerging, policy-dependent |
Cost competitiveness vs. alternatives; infrastructure for transport and reconversion |
Material scale post-2030; dependent on electrolyzer cost reduction |
The Biggest Challenges Slowing Green Hydrogen Adoption
A credible analysis of green hydrogen's trajectory requires direct engagement with the barriers that are currently slowing commercial deployment. Several are commercially significant and are not resolved by optimistic long-term forecasts.
High production costs: According to a DOE hydrogen production cost analysis published in 2024, current green hydrogen production via PEM electrolysis costs USD 5-7 per kilogram without subsidies, based on electrolyzer capital costs averaging USD 2,000/kW and renewable electricity at approximately USD 0.03/kWh. Grey hydrogen from natural gas costs USD 0.5-1.7/kg in regions with low gas prices. That cost gap is the primary commercial barrier to adoption across all industrial applications.
Electrolyzer capital expenditure and manufacturing scale: Electrolyzer manufacturing capacity has expanded, with IEA data from the Global Hydrogen Review 2024 showing that it doubled in 2023 to 25 GW per year. However, actual deployment remains far below manufacturing capacity, with only 2.5 GW of output achieved in 2023. This underutilization reflects the cost gap problem: manufacturers have invested in capacity that the market has not yet justified at commercial scale.
Renewable energy dependency and capacity factor: Electrolyzer economics improve with higher utilization rates; the more hours per year the system operates, the more hydrogen it produces against the same capital base. Capacity factors for dedicated renewable-powered electrolysis range from approximately 25% (solar-only) to 75% (hybrid solar and wind) under current configurations. Higher capacity factors require either hybrid renewable power systems or grid connections that maintain clean electricity certification, both of which add capital cost.
Infrastructure limitations: Hydrogen pipeline networks remain limited outside established industrial corridors. The IEA reports approximately 5,000 km of hydrogen pipelines in operation globally, primarily owned by private companies connecting industrial facilities. Scaling green hydrogen from point-source production to broad industrial supply requires either new pipeline infrastructure or high-cost compression and transport by truck or tube trailer, both of which increase delivered cost.
Regulatory uncertainty: Certification frameworks for green hydrogen are still being finalized in most markets. The EU's Renewable Fuels of Non-Biological Origin (RFNBO) regulation establishes additionality, temporal correlation, and geographic matching requirements for electrolytic hydrogen to qualify as renewable, but interpretations vary, and interactions with carbon pricing mechanisms continue to evolve. Without regulatory certainty, long-term supply contracts are difficult to structure, and project financing remains constrained.
Challenge-Impact Matrix
|
Challenge |
Near-Term Commercial Impact |
Mitigation Pathway |
|
High production cost (USD 5 to 7/kg vs. USD 0.5 to 1.7/kg for grey) |
Industrial customers cannot absorb the cost premium without policy support or carbon pricing |
Scale, electrolyzer cost reduction, renewable electricity PPA rates, IRA and H2Hub subsidies |
|
Electrolyzer CAPEX (USD 2,000/kW average) |
Project returns are unacceptable without a capacity factor above 50% or a subsidy |
Technology cost reduction; manufacturing volume; DOE R&D targets USD 1/kg by 2031 |
|
Renewable electricity dependency |
Variable generation limits electrolyzer utilization and increases unit cost |
Hybrid solar-wind configurations; long-term renewable PPAs; grid electricity with clean certification |
|
Infrastructure gaps |
Delivery cost escalation in regions without hydrogen pipeline access |
On-site generation contracts; H2Hub co-location; EU hydrogen backbone pipeline development |
|
Regulatory uncertainty |
Long-term contracts and project financing difficult to structure |
RFNBO certification framework in Europe; clean hydrogen production tax credit (45V) in the U.S. |
Green Hydrogen Economics: When Does It Become Cost-Competitive?
The cost competitiveness of green hydrogen is a function of three primary variables: the electrolyzer's capital cost, the price and capacity factor of the renewable electricity input, and the production scale. All three are falling.
The DOE's Hydrogen Shot program has set a target of reducing clean hydrogen production costs by 80% to USD 1 per kilogram by 2031. The DOE's Hydrogen and Fuel Cell Technologies Office targets USD 2/kg as a milestone by 2026. IEA analysis in the Global Hydrogen Review 2025 projects that green hydrogen in China could become cost-competitive with unabated fossil-based production by the end of this decade, given low technology costs and cost of capital. In Europe, the cost gap is expected to narrow from rising EU ETS carbon prices and higher natural gas prices relative to other regions. In the U.S. and the Middle East, where natural gas prices remain lower, the gap is projected to persist longer, and blue hydrogen with carbon capture may offer a more competitive near-term bridge.
Worked Example: Green Hydrogen Production Cost Calculation
The following illustrates the cost sensitivity of PEM electrolysis under three scenarios, based on DOE H2A model methodology.
Input Parameters
|
Input Parameter |
Conservative Case |
Base Case |
Optimistic Case |
|
Electricity Price (USD/MWh) |
60 |
40 |
20 |
|
Electrolyzer System CAPEX (USD/kW) |
2,000 |
1,000 |
500 |
|
Capacity Factor |
40% |
60% |
75% |
|
Electrolyzer Efficiency (kWh/kg H₂) |
57.5 |
55 |
50 |
Output Estimates
|
Output Estimate |
Conservative Case |
Base Case |
Optimistic Case |
|
Indicative LCOH (USD/kg H₂) |
~7.0 to 8.0 |
~3.5 to 4.5 |
~1.5 to 2.5 |
|
Annual Production (MW-scale Reference Plant) |
Lower, limited by capacity factor |
Moderate |
Higher, maximizes asset utilization |
|
CO₂ Avoided vs. Grey Hydrogen (kg CO₂/kg H₂) |
~10 to 12 |
~10 to 12 |
~10 to 12 |
Note: Indicative estimates based on DOE H2A model parameters. Actual costs vary by site, procurement, and project structure. Not inclusive of subsidies, tax credits, or oxygen co-product revenue.
Source: DOE Hydrogen Production Cost from PEM Electrolysis, Program Record 24005
The central insight is that electricity cost drives green hydrogen economics more than any other variable. At USD 20/MWh (achievable in regions with excellent solar or wind resources) and with next-generation electrolyzer costs in the USD 500/kW range, green hydrogen production at USD 1.5-2.5/kg becomes feasible. The U.S., EU, China, Middle East, and parts of Latin America all contain regions that could achieve this cost profile by the early 2030s under the IEA's base-case projections.
Decision Framework: Is Green Hydrogen Economically Viable for Your Project?
|
Decision Criterion |
If YES |
If NO |
|
Access to low-cost renewable electricity (< USD 40/MWh)? |
Favorable cost basis for electrolysis; proceed to scale |
Blue hydrogen or grey hydrogen is more competitive in the near term |
|
Mandated carbon reduction target or carbon price above USD 50/t CO₂? |
Green premium is partially offset by carbon compliance costs |
Economics depends primarily on electricity cost alone |
|
Production scale exceed 10,000 kg/day? |
Industrial-scale economics achievable; assess project |
Higher per-kg cost; consider on-site niche or pilot scale |
|
Anchor industrial customer available? |
Project bankability achievable; proceed with detailed feasibility |
Demand risk constrains financing; revisit project timing |
What the Future Holds for Industrial Gases and Green Hydrogen
Green hydrogen is on a path to becoming a mainstream industrial gas, but not on a uniform timeline across regions. In markets with low renewable electricity costs and strong carbon pricing, commercial-scale green hydrogen is viable within this decade. In regions dependent on cheap natural gas, the transition will take longer and likely route through blue hydrogen as a bridge technology.
The policy architecture supporting green hydrogen deployment is now in place across the largest industrial markets. In the United States, the DOE's Regional Clean Hydrogen Hubs program allocated USD 7 billion to fund seven regional hydrogen hub networks, designed to create co-located production, consumption, and infrastructure clusters that reduce delivery cost and demand risk simultaneously. The Bipartisan Infrastructure Law funding for these hubs is designed to be matched by recipient co-investment, targeting nearly USD 50 billion in combined public and private hydrogen investment.
Kings Research's proprietary market analysis projects the global industrial gases market will grow from USD 122.20 billion in 2025 to USD 189.42 billion by 2033, at a CAGR of 5.70%. The Middle East and Africa region is projected to grow at the fastest pace, at a CAGR of 6.05%, driven by significant infrastructure investment across GCC countries, the expansion of petrochemical and industrial sectors, and the development of large-scale green hydrogen export projects targeting European and Asian demand. The Asia Pacific region holds the largest share at 37.60% and benefits from rapid industrial expansion, government support for clean energy, and the presence of dominant electrolyzer manufacturers in China.
The path forward for industrial gas suppliers is a tiered transition. Grey hydrogen supply contracts continue to generate the majority of revenue through the current decade, but the contracts being signed today, particularly in Europe, where the EU ETS and renewable energy mandates create structural cost pressure on grey hydrogen, are increasingly specifying clean hydrogen supply pathways or carbon offset provisions.
Blue hydrogen serves as the commercially competitive bridge in high-gas-availability markets. Green hydrogen captures the new-project pipeline in regions with the right renewable cost profile, and it is the end-state technology toward which global supply chain commitments are being structured.
The industrial gas suppliers who establish green hydrogen production assets, secure long-term renewable power agreements, and build delivery infrastructure now will hold structural advantages when cost parity arrives. That advantage is not primarily technological; electrolysis is not proprietary. It is positional: securing anchor customer contracts, pipeline access, and regulatory certifications before competitors do.
Frequently Asked Questions
What is green hydrogen?
Green hydrogen is hydrogen produced by splitting water through electrolysis using renewable electricity from sources such as solar, wind, or hydropower. Because the process uses renewable energy, it generates little to no direct carbon emissions, making it a key solution for industrial decarbonization.
How is green hydrogen produced?
Green hydrogen is produced by passing electricity through water in an electrolyzer, which separates it into hydrogen and oxygen. When powered by renewable electricity, the resulting hydrogen has a significantly lower carbon footprint than hydrogen produced from fossil fuels.
Why are industrial gas companies investing in green hydrogen?
Industrial gas companies are investing in green hydrogen because customers are seeking lower-carbon alternatives to meet emissions targets and regulatory requirements. Expanding green hydrogen capacity also helps suppliers remain competitive as demand shifts toward cleaner industrial processes.
Which industries use green hydrogen?
Green hydrogen is used in steel production, chemicals, oil refining, semiconductor manufacturing, and energy storage. Adoption is expected to expand as production costs decline and decarbonization requirements become more stringent.
Is green hydrogen cheaper than grey hydrogen?
No. Green hydrogen currently costs more than grey hydrogen because of higher renewable electricity and electrolyzer costs. However, continued technology improvements and larger-scale production are expected to reduce costs over time.
What are the biggest barriers to green hydrogen adoption?
The main challenges are high production costs, expensive electrolyzer infrastructure, limited hydrogen transport and storage networks, and evolving certification standards. These factors currently limit large-scale deployment but are expected to improve as the market matures.
Conclusion
The industrial gases industry is in the middle of its most consequential product transition in decades. Green hydrogen is not replacing grey hydrogen overnight, and the economics of electrolysis are not yet competitive with fossil-based production in most markets. Those facts are real and should not be minimized.
The industrial gas suppliers positioned to capture that growth are those who treat green hydrogen not as a future-state aspiration but as a current investment priority. The infrastructure being built now- electrolyzers, renewable power agreements, storage and distribution assets, and long-term customer contracts- will define the competitive structure of the market when cost parity arrives. That positioning window is open now and will not remain open indefinitely.
Explore the full Kings Research Industrial Gases Market Report for detailed segmentation data, competitive landscape analysis, and regional forecasts through 2033.