Market Definition
The market involves technologies and systems that transform physical objects or surfaces into dynamic visual displays through high-precision projection techniques. The process utilizes specialized hardware and software to align projected imagery with real-world structures, adjusting geometry, scale, and perspective to achieve seamless visual synchronization.
This creates three-dimensional and interactive displays that enhance spatial depth and realism. Projection mapping is widely used in entertainment, advertising, and architecture to create immersive visuals, enhance audience engagement, and transform live events and public displays through dynamic storytelling.
Projection Mapping Market Overview
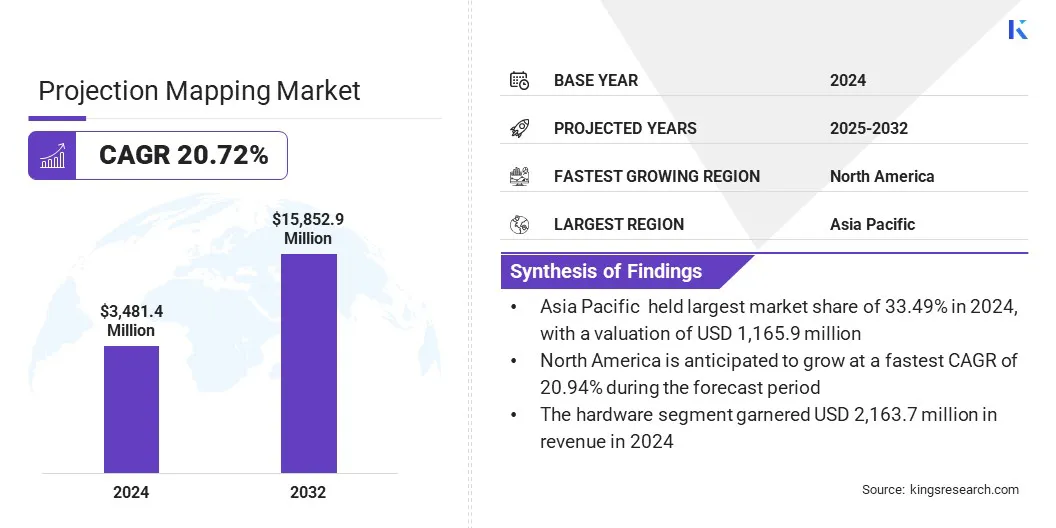
The global projection mapping market size was valued at USD 3,481.4 million in 2024 and is projected to grow from USD 4,174.9 million in 2025 to USD 15,852.9 million by 2032, exhibiting a CAGR of 20.72% during the forecast period.
The growth of the market is driven by the integration of augmented reality (AR) and virtual reality (VR) technologies, which enhance interactivity and realism in visual displays. These technologies enable immersive experiences by synchronizing virtual content with physical environments, making projection mapping more engaging and dynamic.
Key Highlights:
- The projection mapping industry was recorded at USD 3,481.4 million in 2024.
- The market is projected to grow at a CAGR of 20.72% from 2025 to 2032.
- Asia Pacific held a share of 33.49% in 2024, valued at USD 1,165.9 million.
- The hardware segment garnered USD 2,163.7 million in revenue in 2024.
- The 3D segment is expected to reach USD 6,057.0 million by 2032.
- The short throw segment is anticipated to witness the fastest CAGR of 21.08% over the forecast period.
- The large venues and facades segment held a share of 24.12% in 2024.
- North America is anticipated to grow at a CAGR of 20.94% through the projection period.
Major companies operating in the projection mapping market are Panasonic Holdings Corporation, Barco, Seiko Epson Corporation, BenQ, Optoma, Digital Projection International, Sharp NEC Display Solutions, Vivitek (Delta Electronics, Inc.), ViewSonic Corporation, Green Hippo Ltd., SONY ELECTRONICS INC., LG Electronics, A.C. Entertainment Technologies Ireland Ltd, and AV Stumpfl GmbH.
Market growth is driven by the rising demand for immersive event experiences across entertainment, sports, and corporate sectors. Event organizers are increasingly using projection mapping to deliver visually engaging environments that enhance audience interaction.
- In July 2025, Seiko Epson Corporation announced that its projection technology was used to deliver an immersive 360-degree experience at the Expo 2025 Osaka Kansai pavilion for Nagano Prefecture. The installation features high-brightness projectors and tailored visual content to support the region’s tourism-revitalization efforts.
What factors are driving businesses to invest more in digital display infrastructure?
Rising consumer engagement with dynamic visual content, expanding adoption of digital out-of-home advertising, and growing demand for data-driven marketing campaigns are encouraging investments in digital display infrastructure. Governments and enterprises are prioritizing the modernization of display systems for information dissemination, advertising, and interactive engagement.
Projection mapping technologies are being integrated into smart city initiatives, digital signage, and educational spaces. Growing emphasis on visual communication, energy-efficient display systems, and large-format digital installations supports this investment trend, reinforcing the adoption of projection mapping as a flexible, scalable, and cost-efficient visualization technology.
- In July 2025, Oki Electric Industry Co., Ltd. and PT. Netmarks Indonesia entered a partnership to expand the adoption of the Projection Assembly System in Indonesia. The collaboration aimed to enhance OKI’s sales network, accelerate system deployment, and deliver comprehensive local support to improve manufacturing efficiency and quality standardization across the market.
How does the cost factor hinder adoption among small and mid-scale enterprises?
Advanced laser and 3D projectors, specialized software, and complex installation processes significantly elevate initial investment costs. Smaller event organizers and regional production companies face financial limitations in adopting these systems. Cost barriers also extend to maintenance and calibration, which require technical expertise. The overall affordability gap limits large-scale deployments in emerging economies, impacting broader market penetration.
To address this challenge, manufacturers are focusing on developing cost-efficient projection systems through modular designs and extended equipment lifespans. Rental-based service models and technological standardization further reduce ownership costs and enhance accessibility.
Why are event organizers and enterprises shifting toward laser-based projection systems?
Event organizers and enterprises are shifting toward laser-based projection systems due to their superior image clarity, color precision, and long operational life. These systems deliver consistent brightness and require minimal maintenance, making them ideal for large-scale and outdoor applications. Advancements in laser efficiency and compact design further enhance projection quality and reliability across entertainment, architectural, and corporate settings.
- In January 2025, Christie introduced the Sapphire 4K40-RGBH projector, the high-brightness hybrid RGB laser model combining solid-state RGB and dual laser phosphor illumination. The system delivered superior light efficiency, expanded color gamut, and versatility across 2D, 3D, and visualization applications, enhancing projection quality for large-scale immersive environments.
Projection Mapping Market Report Snapshot
|
Segmentation
|
Details
|
|
By Component
|
Hardware, Software
|
|
By Dimension
|
2D, 3D, 4D
|
|
By Throw Distance
|
Short Throw, Standard Throw
|
|
By Application
|
Large Venues and Facades, Events and Festivals, Theme Parks and Attractions, Cultural and Heritage Sites, Commercial Spaces, Others
|
|
By Region
|
North America: U.S., Canada, Mexico
|
|
Europe: France, UK, Spain, Germany, Italy, Russia, Rest of Europe
|
|
Asia-Pacific: China, Japan, India, Australia, ASEAN, South Korea, Rest of Asia-Pacific
|
|
Middle East & Africa: Turkey, U.A.E., Saudi Arabia, South Africa, Rest of Middle East & Africa
|
|
South America: Brazil, Argentina, Rest of South America
|
Market Segmentation:
- By Component (Hardware and Software): The hardware segment generated USD 2,163.7 million in revenue in 2024, mainly due to increasing adoption of high-performance projectors, advanced lenses, and laser light sources in large-scale projection installations.
- By Dimension (2D, 3D, and 4D): The 2D segment is poised to record a CAGR of 20.85% through the forecast period, propelled by growing use of two-dimensional visuals in advertising, events, and architectural projection applications.
- By Throw Distance (Short Throw and Standard Throw): The standard throw segment is estimated to hold a share of 58.97% by 2032, fueled by widespread deployment across auditoriums, museums, and outdoor venues requiring balanced projection distance and clarity.
- By Application (Large Venues and Facades, Events and Festivals, Theme Parks and Attractions, Cultural and Heritage Sites, Commercial Spaces, and Others): The large venues and facades segment is projected to reach USD 3,833.3 million by 2032, owing to rising demand for immersive visual displays in concerts, festivals, and landmark architectural lighting projects.
What is the market scenario in North America and Asia Pacific region?
Based on region, the global projection mapping market has been classified into North America, Europe, Asia Pacific, Middle East & Africa, and South America.
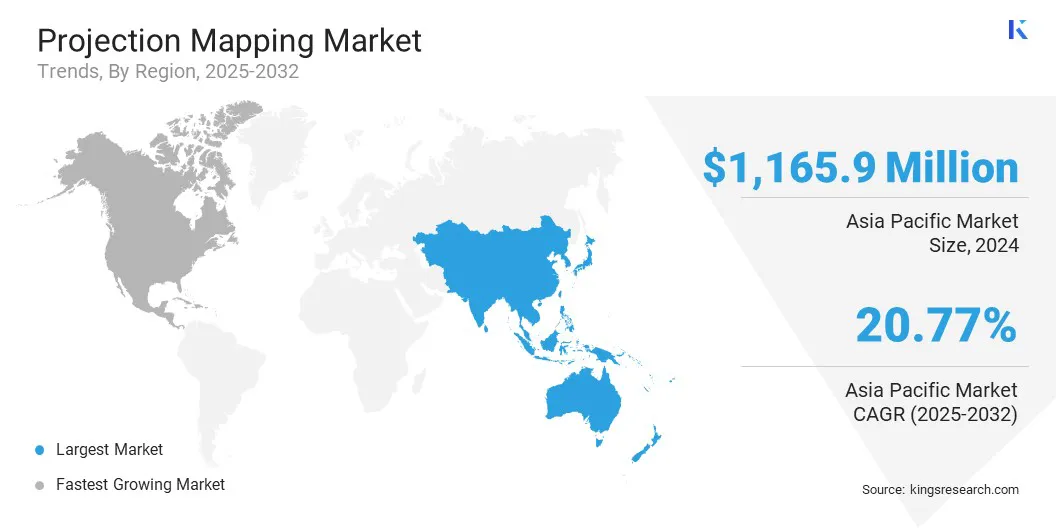
Asia Pacific projection mapping market accounted for a 33.49% share in 2024, valued at USD 1,165.9 million. Market expansion is primarily supported by the rapid integration of digital display technologies across entertainment, commercial, and public infrastructure sectors. Event organizers and venue operators are increasingly investing in projection systems to enhance visual storytelling and audience engagement.
Strong adoption in corporate events, theme parks, and large-scale exhibitions contributes to regional growth. Event organizers, advertising agencies, and entertainment companies are continuously investing in advanced projection hardware and software solutions. Increasing deployment of projection mapping for retail and outdoor advertising further supports market growth in this region.
- In March 2024, Panasonic Connect Co., Ltd. reported that its projection system was used to create the world’s largest permanent projection mapping display at the Tokyo Metropolitan Government Building. The system, operated through AcroSign and Remote Managed Service, allowed cloud-based control, remote monitoring, and streamlined content management across the installation.
The North America projection mapping industry is projected to grow at a CAGR of 20.94% over the forecast period. This dominance is attributed to the strong demand for immersive visual experiences across entertainment, live events, and corporate sectors.
Businesses are leveraging projection mapping to create dynamic brand activations and digital storytelling environments. The adoption of high-resolution projectors, AI-integrated mapping software, and real-time content rendering tools continues to drive market growth.
- In May 2025, Green Hippo announced the shipment of its new 4U Hippotizer MX Series Media Servers, HYCO MX and MEUSE MX. The series introduced five customizable, high-performance media server solutions designed to enhance playback quality, workflow efficiency, and system reliability in professional projection mapping applications.
Regulatory Frameworks
- In the EU, the General Product Safety Regulation (EU) 2023/988 governs the safety standards of projection equipment. It ensures that projection systems, including high-brightness projectors and laser devices, comply with consumer and occupational safety requirements during installation and operation.
- In the U.S., the Federal Communications Commission (FCC) Part 15 Regulation oversees electromagnetic interference from projection equipment. It mandates manufacturers to design and test devices that do not disrupt communication signals, ensuring compliance for electronic display systems.
- In Japan, the Electrical Appliance and Material Safety Act (DENAN) enforces product certification and safety testing for projection hardware. It regulates electrical specifications, laser output, and component safety for commercial deployment.
- In China, the Compulsory Product Certification (CCC) System regulates the conformity assessment of projection devices. It ensures adherence to national safety, quality, and performance standards before market entry.
- In India, the Bureau of Indian Standards (BIS) Certification Scheme supervises quality and safety standards for electrical and optical projection equipment. It establishes guidelines for safe installation and operation across public and commercial environments.
Competitive Landscape
Key players operating in the market are focusing on continuous product innovation through the development of high-lumen projectors, laser-based systems, and energy-efficient optical technologies. Manufacturers are also enhancing R&D capabilities to improve image precision, scalability, and real-time projection performance.
Companies are expanding their service portfolios through rental and subscription-based business models to address diverse customer segments. In addition, partnerships and collaborations with event production firms and software developers are being established to expand integrated solution offerings.
- In October 2025, Christie Digital Systems was appointed the exclusive projection partner for the 2025 Australian International Movie Convention (AIMC) held at The Star Gold Coast. The company’s CineLife+ Series RGB pure-laser projectors will power screenings and presentations during the event, supporting the cinema industry with high-quality visuals.
Key Companies in Projection Mapping Market:
- Panasonic Holdings Corporation
- Barco
- Seiko Epson Corporation
- BenQ
- Optoma
- Digital Projection International
- Sharp NEC Display Solutions
- Vivitek (Delta Electronics, Inc.)
- ViewSonic Corporation
- Green Hippo Ltd.
- SONY ELECTRONICS INC.
- LG Electronics
- C. Entertainment Technologies Ireland Ltd
- AV Stumpfl GmbH
Recent Developments (Agreements/Product Launch)
- In January 2024, Barco launched the I600 and QDX projector families, introducing a new flagship line featuring higher resolution, improved brightness, and greater versatility within a compact and efficient design.


