Market Definition
Raman spectroscopy is an analytical technique that measures the inelastic scattering of monochromatic light when it interacts with molecular vibrations. It delivers non-destructive, high-resolution characterization of molecular structures and compositions. The market scope spans pharmaceuticals, materials science, environmental monitoring, and forensic analysis, which require detailed molecular insight is essential.
Scientists and quality control professionals use Raman spectroscopy to identify compounds, assess crystallinity, monitor reactions in real time, and verify product authenticity with minimal sample preparation.
Raman Spectroscopy Market Overview
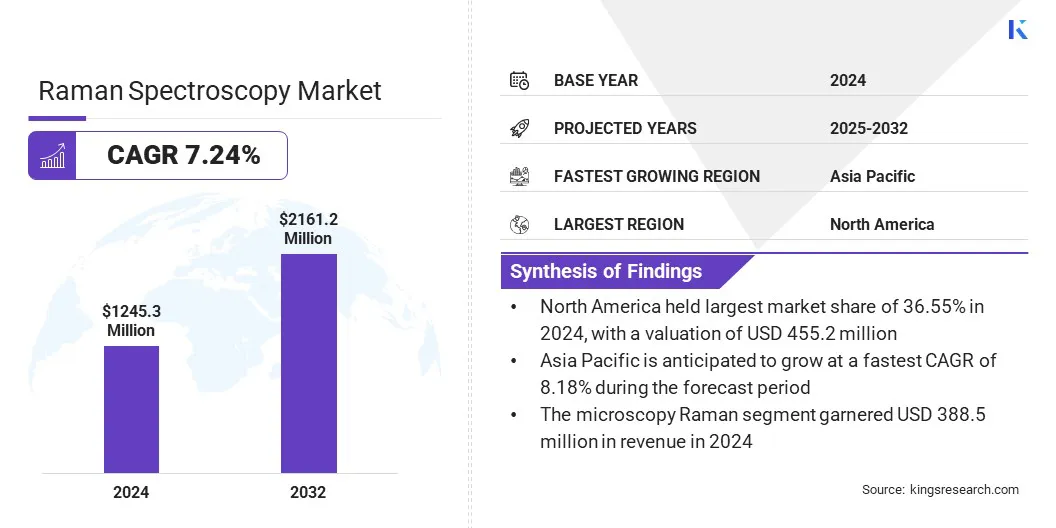
The global Raman spectroscopy market size was valued at USD 1,245.3 million in 2024 and is projected to grow from USD 1,324.7 million in 2025 to USD 2,161.2 million by 2032, exhibiting a CAGR of 7.24% during the forecast period.
The market is driven by its expanding adoption in clinical diagnostics and disease detection, offering non-invasive analysis with high sensitivity. Additionally, the integration of Surface-Enhanced Raman Scattering (SERS) with advanced microscopy is enabling trace-level detection in complex samples, supporting broader adoption in biomedical and materials research.
Major companies operating in the Raman spectroscopy industry are Thermo Fisher Scientific Inc., Horiba Ltd., Renishaw plc, Bruker Corporation, Agilent Technologies Inc., PerkinElmer, METTLER TOLEDO, Rigaku Holdings Corporation, Oxford Instruments, B&W Tek, JASCO, Hamamatsu Photonics K.K., Anton Paar GmbH, SciAps Inc., and Metrohm AG.
Rapid growth in pharmaceutical and biotechnology research and development is driving the adoption of Raman spectroscopy across drug discovery and manufacturing processes. Raman techniques are being widely used for real-time molecular analysis, structural characterization, and identification of active pharmaceutical ingredients.
Emphasis on improving quality control and regulatory compliance is encouraging the use of non-destructive, label-free analytical tools. Protein analysis, formulation studies, and process monitoring are increasingly relying on Raman systems for precise and efficient results. Researchers and manufacturers are adopting Raman spectroscopy to accelerate development timelines and ensure consistent product quality.
Key Highlights
- The Raman spectroscopy industry size was valued at USD 1,245.3 million in 2024.
- The market is projected to grow at a CAGR of 7.24% from 2025 to 2032.
- North America held a market share of 36.55% in 2024, with a valuation of USD 455.2 million.
- The handheld & portable Raman segment garnered USD 538.3 million in revenue in 2024.
- The tip-enhanced Raman scattering segment is expected to reach USD 889.6 million by 2032.
- The pharmaceuticals & biotechnology segment secured the largest revenue share of 34.34% in 2024.
- Asia Pacific is anticipated to grow at a CAGR of 8.18% during the forecast period.
Market Driver
Expanding Clinical Diagnostics and Disease Detection
Expanding use of Raman spectroscopy in clinical diagnostics is driving its adoption across the healthcare sector. Advancements in non-invasive detection methods are enabling Raman techniques to identify diseases such as cancer, neurological disorders, and bacterial infections with high sensitivity and specificity.
For instance, in March 2025, a meta-analysis of lung‑cancer diagnostic studies published in the National Library of Medicine (NLM) found that Raman spectroscopy had a pooled sensitivity of 98.7 % and specificity of 91.8 %, demonstrating over 90 % accuracy in detecting early-stage lung cancer.
Healthcare providers are incorporating Raman systems to analyze biological tissues, fluids, and cells without the need for dyes or extensive sample preparation. Early and accurate disease detection is becoming critical for improving treatment outcomes and patient management, boosting the Raman spectroscopy market expansion. Raman spectroscopy is offering rapid diagnostic capabilities that support point-of-care testing and personalized healthcare solutions.
Market Challenge
High Equipment and Operational Costs Limiting Wider Adoption
A key challenge in the Raman spectroscopy market is the considerable investment required for high-performance instruments, including lasers, precision optics, and sensitive detectors. Ongoing maintenance, calibration, and technical expertise further increase operational expenses, raising the total cost of ownership. These financial and resource constraints limit adoption among smaller research facilities and enterprises, restricting the broader use of Raman systems.
To address this challenge, market players are introducing compact and cost-effective models, offering flexible financing options, and providing bundled service plans to lower the adoption barrier. Companies are also focusing on improving system reliability and reducing maintenance requirements to make the technology more accessible across various sectors.
Market Trend
Surface-Enhanced Raman Scattering (SERS) & Microscopy Integration
A key trend in the Raman spectroscopy market is the integration of surface-enhanced Raman scattering (SERS) techniques with advanced microscopy systems. Researchers are using nanostructured substrates to amplify Raman signals, allowing for the detection of extremely low concentrations of target molecules. Coupling these substrates with high-resolution microscopy is enabling more precise spatial analysis in complex samples.
This approach is expanding the capabilities of Raman spectroscopy in biomedical diagnostics, materials characterization, and forensic analysis. Improved sensitivity and imaging are supporting early-stage detection and detailed structural assessment in various research and industrial settings. The market is advancing through combined technologies that enhance both analytical depth and spatial resolution.
- In May 2024, researchers from the Indian Institute of Science (IISc) published a study describing a home-built SERS-integrated atomic force microscope (a‑NSOM) that combines near-field scanning optical microscopy (NSOM) with SERS detection. The system used a fine-tuned gold nanoparticle aggregate on a substrate and a tapered fiber probe to collect SERS signals from individual hotspots at ~10–15 nm proximity to the sample surface.
Raman Spectroscopy Market Report Snapshot
|
Segmentation
|
Details
|
|
By Instrument Type
|
Microscopy Raman, FT Raman, Handheld & Portable Raman, Others
|
|
By Sampling Technique
|
Surface-Enhanced Raman Scattering, Tip-Enhanced Raman Scattering, Resonance Raman Scattering, Others
|
|
By Application
|
Pharmaceuticals & Biotechnology, Material Science, Chemical Industry, Food & Agriculture, Others
|
|
By Region
|
North America: U.S., Canada, Mexico
|
|
Europe: France, UK, Spain, Germany, Italy, Russia, Rest of Europe
|
|
Asia-Pacific: China, Japan, India, Australia, ASEAN, South Korea, Rest of Asia-Pacific
|
|
Middle East & Africa: Turkey, U.A.E., Saudi Arabia, South Africa, Rest of Middle East & Africa
|
|
South America: Brazil, Argentina, Rest of South America
|
Market Segmentation
- By Instrument Type (Microscopy Raman, FT Raman, Handheld & Portable Raman, and Others): The handheld & portable Raman segment earned USD 538.3 million in 2024 due to its growing demand for on-site, real-time analysis across pharmaceuticals, forensics, and environmental testing, offering flexibility, speed, and ease of use.
- By Sampling Technique (Surface-Enhanced Raman Scattering, Tip-Enhanced Raman Scattering, Resonance Raman Scattering, and Others): The surface-enhanced Raman scattering segment held 34.32% of the market in 2024, due to its ability to deliver ultra-sensitive molecular detection, making it highly valuable for trace analysis in pharmaceuticals, biomedical diagnostics, and environmental monitoring.
- By Application (Pharmaceuticals & Biotechnology, Material Science, Chemical Industry, Food & Agriculture, and Others): The pharmaceuticals & biotechnology segment is projected to reach USD 808.7 million by 2032, owing to its critical role in real-time, non-destructive analysis for drug development, quality control, and regulatory compliance.
Raman Spectroscopy Market Regional Analysis
Based on region, the market has been classified into North America, Europe, Asia Pacific, Middle East & Africa, and South America.
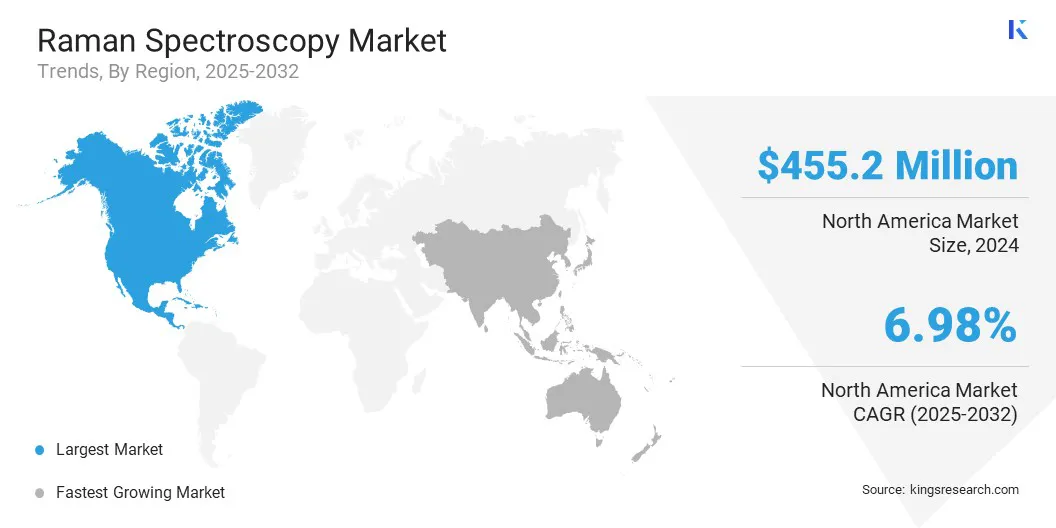
The North America Raman spectroscopy market share stood around 36.55% in 2024 in the global market, with a valuation of USD 455.2 million. This dominance is driven by North America's strong concentration of pharmaceutical and biotechnology companies, particularly in the U.S. and Canada.
These firms are heavily engaged in drug discovery, formulation development, and process monitoring, and are increasingly adopting Raman spectroscopy for real-time, non-destructive molecular analysis. This enhances both the speed and accuracy of research and quality control.
- In February 2024, the U.S. Food and Drug Administration (FDA) reported on a study evaluating the use of stimulated Raman scattering (SRS) microscopy for assessing topical product bioequivalence (BE) in human skin. The study demonstrated that SRS imaging, combined with a polymer-based standard reference, enabled quantitative analysis of drug permeation and BE between branded and generic tazarotene formulations.
The Raman spectroscopy industry in Asia Pacific is set to grow at a significant CAGR of 8.18% over the forecast period. This growth is driven by active investments across several Asia Pacific countries in enhancing research infrastructure and promoting advanced analytical technologies through national innovation programs.
Universities and public research institutions are equipping their laboratories with high-end instruments, including Raman spectroscopy systems, to support research in materials science, biomedicine, and nanotechnology. These efforts are strengthening the regional research ecosystem and steadily expanding the adoption of Raman spectroscopy.
- In October 2024, researchers at the University of Tokyo developed a new coherent Raman spectroscopy system that boosts measurement speed by 100‑fold, achieving rates up to 50 MSpectra/s. System combines ultrashort femtosecond pulse lasers and time‑stretch detection technology. Platform enables high‑throughput, label‑free chemical imaging, useful for biomedical diagnostics and materials science research.
Regulatory Frameworks
- In the U.S., Raman spectroscopy used in pharmaceutical manufacturing is regulated under the U.S. Food and Drug Administration (FDA)’s Process Analytical Technology (PAT) framework and 21 CFR Part 610.14 for biologics. Raman systems are often classified as Class II medical devices, requiring FDA 510(k) clearance.
- In the European Union, Raman spectroscopy is governed by the European Pharmacopoeia (Ph. Eur.) General Chapter 2.2.48, which outlines instrument calibration, spectral resolution standards, and validation procedures. The European Medicines Agency (EMA) promotes its use through support for PAT under the International Council for Harmonisation (ICH) guidelines Q8 to Q11, which cover pharmaceutical development and manufacturing.
- In Japan, Raman spectroscopy is regulated by the Japanese Pharmacopoeia (JP), with the 18th edition (JP18) including a comprehensive Raman chapter. The Ministry of Health, Labour and Welfare (MHLW) aligns with ICH Q8–Q11 for pharmaceutical quality assurance. JP standards mandate instrument calibration using materials like polystyrene, as well as clear validation protocols for both handheld and microscopic Raman systems.
- In India, Raman spectroscopy is governed by the Central Drugs Standard Control Organization (CDSCO) and must adhere to Good Manufacturing Practices (GMP) as outlined in the Drugs and Cosmetics Act. The country follows harmonized ICH guidelines Q8 to Q11 for pharmaceutical development.
Competitive Landscape
Major players in the Raman spectroscopy industry are adopting strategies such as collaborative research initiatives, advanced instrumentation development, and strategic partnerships with scientific organizations, contributing to the growth of the market. Companies are increasingly investing in research and development (R&D) to enhance spectrometer sensitivity, software integration, and data processing capabilities.
Collaborations with space and planetary science institutions also reflect a growing focus on expanding Raman applications into non-traditional fields like astrochemistry and material science are helping broaden market potential and end-user engagement.
- In July 2024, JASCO assisted NASA with the development of its Raman Spectroscopic Database (Ramdb v1.00). JASCO’s contribution involved using its NRS‑5500 Raman spectrometer and Spectra Manager software to analyze samples for inclusion in the database. This database provides publicly accessible planetary science spectral data, supporting UV‑ and electron‑irradiated sample analyses at NASA’s ICEE facility
List of Key Companies in Raman Spectroscopy Market:
- Thermo Fisher Scientific Inc.
- Horiba Ltd.
- Renishaw plc
- Bruker Corporation
- Agilent Technologies Inc.
- PerkinElmer
- METTLER TOLEDO
- Rigaku Holdings Corporation
- Oxford Instruments
- B&W Tek
- JASCO
- Hamamatsu Photonics K.K.
- Anton Paar GmbH
- SciAps Inc.
- Metrohm AG
Recent Developments (Product Launches)
- In January, 2025, Bruker introduced the LUMOS II ILIM infrared imaging microscope incorporating quantum cascade laser technology. While primarily an IR instrument, the platform complements Raman analysis by enabling high-resolution chemical imaging in pharmaceutical and life science research. The system features full automation, artifact-free imaging, and wide field-of-view operation.
- In 2024, Hübner Photonics released the Cobolt 08‑01 Series narrow-linewidth lasers optimized for high-resolution Raman spectroscopy. These compact lasers cover wavelengths from 405 nm to 1,064 nm and feature <1 pm stability over eight hours. The design supports enhanced spectral purity and stability, meeting stringent performance requirements for advanced Raman analysis
- In December, 2024, Wasatch Photonics released “Making Raman Measurements Reproducible,” a technical note showcasing methods to achieve greater than 99.5 % unit-to-unit spectral consistency. The guidelines emphasize calibration, background correction, and standardized acquisition workflows for Raman OEM systems. This initiative supports scalable deployment of consistent measurements across multiple units
- In January 2024, Wasatch Photonics launched its WP Raman X series of compact spectrometers and systems. This flagship line includes modular spectrometers, integrated lasers, complete Raman systems, and OEM modules covering excitation wavelengths from 532 nm to 1064 nm. High sensitivity is achieved through bespoke volume phase holographic gratings and a unified optomechanical design tailored for research and OEM applications.
often find it difficult to justify these expenses


